
Opis
🚀 Narzędzie do rysowania stref HF EGO: błyskawiczne, idealnie dopasowane strefy
Zmęczony walką z natywnymi narzędziami do wykresów? Spędzasz za dużo czasu na ręcznym przeciąganiu prostokątów zamiast faktycznej analizy rynku? Poznaj swoją nową nieuczciwą przewagę.
Narzędzie do rysowania stref HF EGO to premium, sterowane skrótami klawiszowymi narzędzie zaprojektowane, aby całkowicie zautomatyzować i przyspieszyć Twoją rutynę oznaczania wykresów. Rysuj, edytuj i zarządzaj swoimi strefami handlowymi bez żadnych przeszkód i z matematyczną precyzją.
📊 Jakie dane rynkowe analizuje
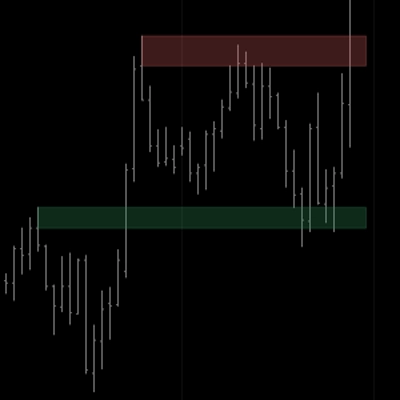
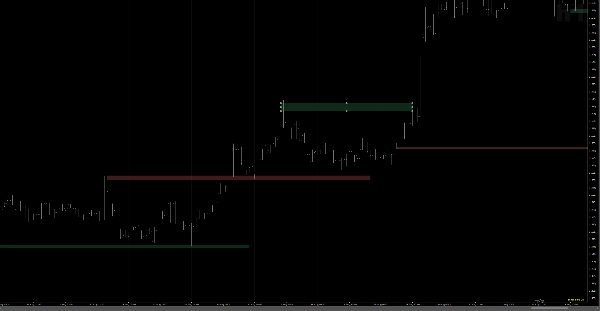
To nie jest podstawowe narzędzie do rysowania. Wskaźnik natychmiast analizuje dane świec OHLC (Open, High, Low, Close) w czasie rzeczywistym w miejscu, gdzie znajduje się Twój kursor. Oblicza dokładny rozstęp między korpusem a knotem świecy, automatycznie generując idealnie dopasowaną strefę, która precyzyjnie przylega do danych rynkowych. Koniec z powiększaniem, by poprawić niedbałe krawędzie!
🎨 Interpretacja sygnałów i wizualizacji
Narzędzie całkowicie automatyzuje kodowanie kolorów. Na podstawie kierunku świecy przypisuje natychmiast byczy (np. Popyt / Wsparcie) lub niedźwiedzi (np. Podaż / Opór) motyw kolorystyczny.
- Zielona/Strefa bycza: Automatycznie rysowana na świecach byczych.
- Czerwona/Strefa niedźwiedzia: Automatycznie rysowana na świecach niedźwiedzich. Potrzebujesz zmienić nastawienie? Proste podwójne kliknięcie na strefę natychmiast zmienia jej kolor.
⚙️ Kluczowe ustawienia i skróty klawiszowe (magia)
Szybkość to wszystko. Zastąpiliśmy uciążliwe menu intuicyjnymi kombinacjami klawiatury i myszy:
- Podwójne kliknięcie lub Shift + kliknięcie (na pustym miejscu): Natychmiast utwórz nową strefę idealnie dopasowaną do świecy pod kursorem.
- Podwójne kliknięcie (na strefie): Zmień kolor strefy (byczy ↔ niedźwiedzi).
- Alt + kliknięcie (na strefie): Natychmiast wydłuż strefę w przyszłość o zdefiniowaną przez Ciebie liczbę słupków.
- Ctrl + kliknięcie (na strefie): Precyzyjnie przesuń strefę z powrotem do jej świecy początkowej.
- Shift + kliknięcie (na strefie): Natychmiast usuń strefę.
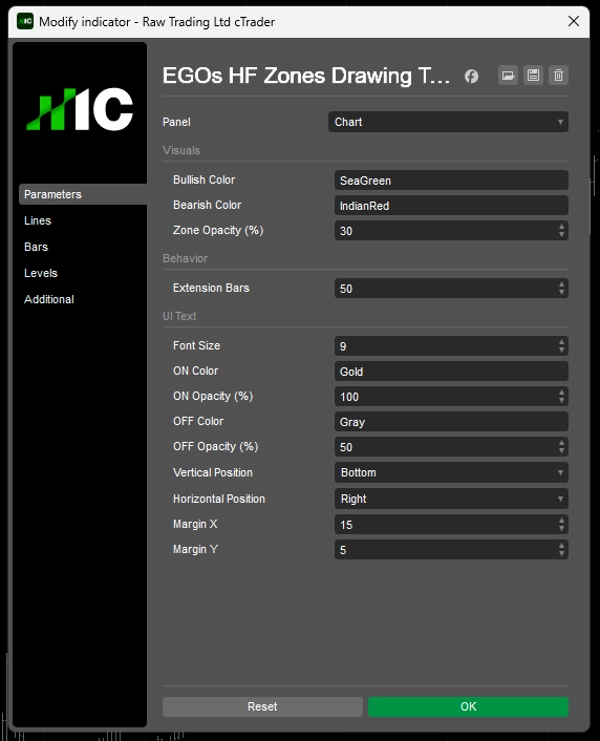
- Personalizacja: W pełni regulowane kolory, przezroczystość 0-100% oraz niestandardowe pozycjonowanie tekstu UI. Naciśnij 'H' na klawiaturze, aby przełączyć elegancką ściągę na wykresie i nigdy nie zapomnieć skrótu!
🎯 Typowe zastosowania i scenariusze handlowe
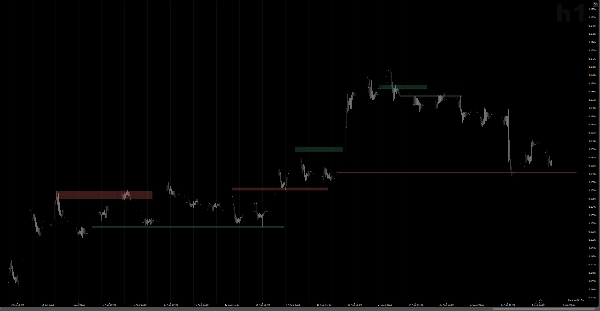
Stworzone specjalnie do analizy od góry do dołu. Niezależnie czy mapujesz makro trendy miesięczne/tygodniowe, czy dopracowujesz obszary wykonania H1, to narzędzie skraca czas oznaczania wykresów o 80%. To absolutnie najlepszy towarzysz do rysowania:
- Stref podaży i popytu
- Bloków zleceń (OB) i luk wartości godziwej (FVG)
- Kluczowych poziomów wsparcia i oporu
- Stref konfluencji dla wejść po wybiciu lub cofnięciu.
👤 Dla kogo jest ten wskaźnik?
Jeśli Twoja strategia opiera się na strefach, to narzędzie jest obowiązkowe w Twoim zestawie.
- Traderzy SMC (Smart Money Concepts) i Price Action: którzy potrzebują chirurgicznie precyzyjnych bloków zleceń.
- Traderzy swingowi i pozycyjni: którzy zarządzają wieloma wykresami i ramami czasowymi i chcą utrzymać swoje miejsce pracy czyste i efektywne.
- Poziom doświadczenia: od początkujących, którzy chcą czystszych, bezbłędnych wykresów, po doświadczonych profesjonalistów ceniących swój czas i wymagających efektywności.
⚠️ Ważne uwagi i ograniczenia
Aby zapewnić błyskawiczną wydajność i uniknąć konfliktów z natywnymi właściwościami podwójnego kliknięcia cTrader, narzędzie działa z genialną funkcją trybu edycji.
- Edycja stref: WYŁĄCZONA (domyślnie): Strefy są zablokowane na miejscu. Twoje skróty klawiszowe (zmiana koloru, wydłużenie, usunięcie) działają natychmiast bez przypadkowego przesuwania strefy.
- Edycja stref: WŁĄCZONA (naciśnij
prawy Shift): Strefy stają się "odblokowane". Teraz możesz używać natywnych funkcji cTrader, aby ręcznie przeciągać, rozciągać lub przesuwać rogi za pomocą myszy.
Przestań rysować ręczne prostokąty. Zautomatyzuj swoją rutynę, wyeliminuj błędy pikselowe i handluj z absolutną precyzją. Zdobywaj narzędzie do rysowania stref HF EGO już dziś!
Podsumowanie
Key features include instant zone creation, resizing, extending, deleting, and re-snapping using intuitive keyboard and mouse shortcuts, eliminating manual rectangle drawing. Users can customize colors, opacity, and text positioning, with an on-chart shortcut reference available.
The tool supports top-down analysis across multiple timeframes, facilitating the marking of supply and demand zones, order blocks, fair value gaps, key support and resistance levels, and confluence zones for breakout or pullback entries. It is suitable for Smart Money Concepts and price action traders, swing and position traders, and users of all experience levels seeking precise, efficient chart markup.
An Edit Mode allows toggling between locked zones for quick hotkey actions and unlocked zones for manual adjustments using native chart functions. This indicator is optimized for cTrader and focuses on visual zone drawing based on bar data.