
Mô tả
🔷 Động Cơ Đường Xu Hướng Cao Cấp
Cấu Trúc Thị Trường Đa Lớp & Chỉ Báo Hồi Quy Động
https://chartshots.spotware.com/c/69d3c949a2e08
📌 Nó là gì?
Động Cơ Đường Xu Hướng Cao Cấp là một chỉ báo phủ kết hợp 5 mô-đun độc lập thành một công cụ duy nhất. Mỗi mô-đun có thể bật hoặc tắt. Nó vẽ cấu trúc thị trường, các kênh động và các vùng hồi quy dựa trên khối lượng trực tiếp trên biểu đồ giá.
Nó trả lời ba câu hỏi cốt lõi:
- Giá đang ở vị trí nào trong cấu trúc hiện tại?
- Xu hướng chi phối là gì và điểm phá vỡ ở đâu?
- Hoạt động tập trung ở mức giá nào?
🧩 5 Mô-đun
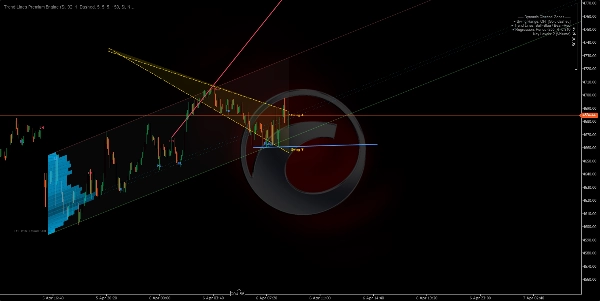
1️⃣ Kết Nối Phạm Vi Dao Động
https://chartshots.spotware.com/c/69d3cab9b805b
Phát hiện các đỉnh và đáy dao động gần nhất, sau đó vẽ một kênh nghiêng kết nối điểm cũ nhất với mới nhất ở cả hai bên. Khu vực giữa được tô đầy như một vùng phạm vi động.
Cách hoạt động:
- Một thanh được coi là điểm dao động khi giá cao (hoặc thấp) của nó là cực trị so với N thanh trước và N thanh sau.
- Một đường thẳng được vẽ từ điểm dao động lưu trữ cũ nhất đến điểm mới nhất, tạo ra các ranh giới trên và dưới.
- Kênh tự động dịch chuyển mỗi khi một điểm dao động mới được xác nhận.
Cách đọc:
- Giá trong kênh → phạm vi cấu trúc đã xác định.
- Phá vỡ lên/xuống → mở rộng biến động hoặc thay đổi cấu trúc.
- Độ nghiêng kênh → hướng phạm vi chủ đạo.
Tham số
Mục đích
Số thanh trước / sau dao động
Số thanh cần thiết ở mỗi bên để xác nhận dao động. Cao hơn = dao động quan trọng hơn
Số điểm dao động tối đa
Số dao động được lưu trữ. Điều khiển độ sâu kênh
Cửa sổ lịch sử
Khoảng thời gian kênh được vẽ trở lại
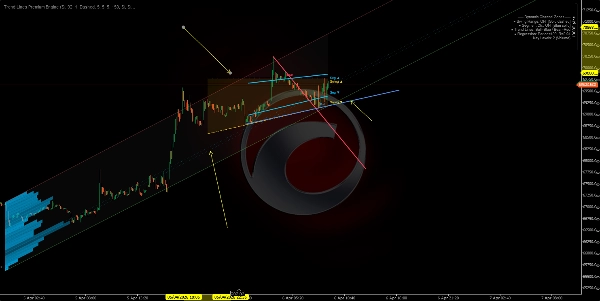
2️⃣ Kênh Tuyến Tính Phân Đoạn
https://chartshots.spotware.com/c/69d3cb221bba1
Chia cửa sổ phân tích thành 5 phân đoạn bằng nhau, tìm đỉnh cao nhất và đáy thấp nhất trong mỗi phân đoạn, sau đó phù hợp một đường hồi quy bình phương tối thiểu qua 5 điểm trên và một đường khác qua 5 điểm dưới.
Cách hoạt động:
- Cửa sổ được chia thành 5 phần. Mỗi phần lấy một điểm cực trị đại diện.
- Hồi quy tuyến tính được áp dụng trên 5 điểm đó cho mỗi ranh giới.
- Kết quả là một kênh thích ứng với cấu trúc giá phân đoạn thay vì chỉ hai điểm cuối.
Cách đọc:
- Kênh đi lên → xu hướng tăng cấu trúc.
- Kênh đi xuống → xu hướng giảm cấu trúc.
- Chạm nhiều lần vào một ranh giới → hỗ trợ/kháng cự động.
Khác biệt với Mô-đun 1: Kết Nối Phạm Vi Dao Động chỉ nối điểm dao động đầu và cuối. Kênh Phân Đoạn sử dụng hồi quy 5 điểm, làm cho nó mượt mà hơn và ít phản ứng với một dao động đơn lẻ.
3️⃣ Nhãn Điểm Dao Động
Phát hiện các đỉnh và đáy dao động và phân loại chúng thành 4 loại cấu trúc thị trường:
Nhãn
Ý nghĩa
Chỉ ra
HL
Đáy Cao Hơn
Cấu trúc tăng
HH
Đỉnh Cao Hơn
Cấu trúc tăng
LH
Đỉnh Thấp Hơn
Cấu trúc giảm
LL
Đáy Thấp Hơn
Cấu trúc giảm
Cách hoạt động:
- Mỗi đáy dao động mới được so sánh với đáy dao động trước đó. Cao hơn → HL. Thấp hơn → LL.
- Mỗi đỉnh dao động mới được so sánh với đỉnh dao động trước đó. Cao hơn → HH. Thấp hơn → LH.
Cách đọc:
- Chuỗi HL + HH → xu hướng tăng còn nguyên vẹn.
- Chuỗi LH + LL → xu hướng giảm còn nguyên vẹn.
- Một HL phá vỡ thành LL, hoặc một LH phá vỡ thành HH → thay đổi cấu trúc (BOS/CHoCH).
Mặc định chỉ hiển thị HL và LH để giữ biểu đồ sạch sẽ. HH và LL có thể được bật để xem đầy đủ cấu trúc.
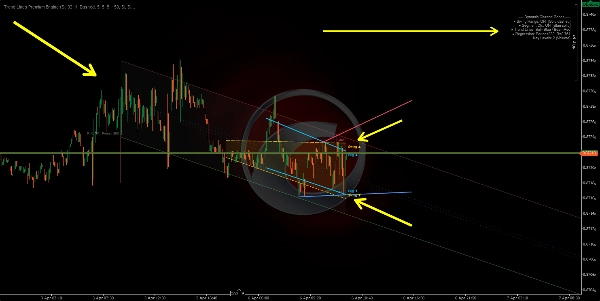
4️⃣ Đường Xu Hướng Tự Động
https://chartshots.spotware.com/c/69d3cc071272e
Vẽ các đường xu hướng kết nối hai đáy dao động gần nhất (đường tăng) và hai đỉnh dao động gần nhất (đường giảm). Đường đang hoạt động nổi bật; các đường trước mờ dần.
Cách hoạt động:
- Phát hiện đáy dao động mới → vẽ đường từ đáy dao động trước đến đáy mới (đường xu hướng tăng).
- Phát hiện đỉnh dao động mới → vẽ đường từ đỉnh dao động trước đến đỉnh mới (đường xu hướng giảm).
- Đường được chiếu về phía trước theo số thanh có thể cấu hình.
- Khi tạo đường mới, đường trước đó mờ dần thành màu bán trong suốt.
Tín hiệu phá vỡ (tùy chọn): Khi bật, chỉ báo phát hiện nếu giá đóng cửa cắt qua đường xu hướng đang hoạt động:
- 🔼 Mũi tên lên → phá vỡ tăng.
- 🔽 Mũi tên xuống → phá vỡ giảm.
Tham số
Mục đích
Số cặp đường tối đa
Số cặp đường giữ hiển thị. Đặt 1 để có cái nhìn sạch nhất
Số thanh mở rộng tối đa
Khoảng cách đường chiếu về phía trước. Ngăn đường cắt toàn bộ biểu đồ
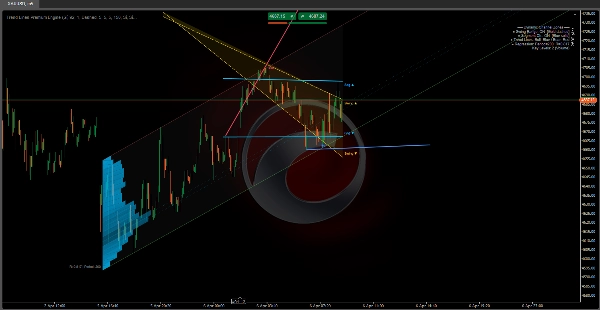
5️⃣ Vùng Hồi Quy Động
Mô-đun tiên tiến nhất. Tính toán một kênh hồi quy tuyến tính trên giá đóng cửa và phủ lên một hồ sơ hoạt động (biểu đồ cột) cho thấy nơi khối lượng hoặc số lần chạm tập trung trong kênh. Nó cũng đánh dấu các mức quan trọng tại các vùng hoạt động cao nhất.
A) Kênh Hồi Quy:
- Hồi quy tuyến tính bình phương tối thiểu được áp dụng cho giá đóng cửa trong một khoảng thời gian nhất định.
- Tính độ lệch chuẩn của giá so với đường hồi quy.
- Các dải trên và dưới được đặt cách trung tâm N độ lệch chuẩn (mặc định: 2.0).
- Tùy chọn tính theo thang đo logarit để chính xác hơn trên các công cụ giá cao hoặc biến động lớn.
B) Phát Hiện Chu Kỳ Tự Động:
- Thuật toán thử nhiều chu kỳ (50 đến 400 thanh) và tính hệ số tương quan Pearson cho mỗi chu kỳ.
- Chọn chu kỳ có tương quan cao nhất — nơi hồi quy tuyến tính phù hợp nhất với biến động giá.
- Giá trị tương quan được hiển thị trên biểu đồ (ví dụ, R = 0.85).
C) Biểu Đồ Hoạt Động:
- Kênh được chia thành các phần ngang (tối đa 25).
- Với mỗi phần, thuật toán đếm số thanh chạm mức giá đó, được trọng số theo khối lượng hoặc số lần chạm (có thể cấu hình).
- Các phần có hoạt động cao hơn xuất hiện dưới dạng các thanh dài hơn, đậm hơn.
- Điều này tiết lộ Điểm Kiểm Soát (POC) và các vùng hoạt động cao/thấp trong kênh.
D) Các Mức Quan Trọng:
- Các phần có hoạt động cao nhất được chiếu về phía trước dưới dạng đường ngang.
- Chúng hoạt động như hỗ trợ và kháng cự dựa trên khối lượng trong bối cảnh hồi quy.
Cách đọc:
- Giá gần dải trên → vùng mua quá mức theo thống kê.
- Giá gần dải dưới → vùng bán quá mức theo thống kê.
- R gần 1 hoặc -1 → xu hướng tuyến tính mạnh và đáng tin cậy. R gần 0 → dao động hoặc hồi quy không đáng kể.
- Các mức quan trọng hoạt động như nam châm giá — các vùng có hoạt động lịch sử tập trung có xu hướng thu hút giá trở lại.
🎯 Các Trường Hợp Sử Dụng
Trường hợp sử dụng
Mô-đun
Xác định cấu trúc thị trường (tăng/giảm/phạm vi)
Nhãn dao động + Đường xu hướng
Phát hiện hỗ trợ & kháng cự động
Phạm vi dao động + Kênh phân đoạn
Tìm vùng giá trị theo khối lượng
Vùng hồi quy + Các mức quan trọng
Xác nhận phá vỡ cấu trúc
Đường xu hướng + Tín hiệu phá vỡ
Đo sức mạnh xu hướng
Hệ số tương quan Pearson (Vùng hồi quy)
⚙️ Cài Đặt Đề Xuất Theo Phong Cách
Phong cách
Mô-đun đề xuất
Giao dịch nhanh (M1–M15)
Nhãn dao động + Đường xu hướng
Giao dịch trong ngày (M15–H1)
Tất cả các mô-đun
Giao dịch dao động (H4–D1)
Phạm vi dao động + Vùng hồi quy + Các mức quan trọng
Chỉ phân tích cấu trúc thuần túy
Chỉ nhãn dao động + Đường xu hướng
⚠️ Lưu Ý Quan Trọng
Tóm tắt
The five modules include:
1. Swing Range Connector: Detects recent swing highs and lows to draw a sloped channel representing the structural range.
2. Segment Linear Channel: Divides the analysis window into five segments, fitting regression lines through highs and lows for a smoother channel.
3. Swing Point Labels: Classifies swing highs and lows into four market structure categories (Higher High, Higher Low, Lower High, Lower Low) to indicate bullish or bearish trends and structure shifts.
4. Automatic Trend Lines: Connects the two most recent swing highs and lows with trend lines, highlighting active lines and optionally signaling breakouts.
5. Dynamic Regression Zone: Calculates a linear regression channel on closing prices with an activity histogram showing volume or touch concentration, marking key volume-based support and resistance levels.
The indicator supports various trading styles, recommending specific module combinations for scalping, intraday, swing trading, and pure structure analysis. It requires price bars and volume data and provides visualizations and signals including breakout, trend strength, and level touches or breaks.


