说明
🧠 OBScope™ – 高概率交易的精确订单区块映射
通过OBScope™解锁市场的隐藏结构,这是一款尖端指标,旨在基于波段高点、波段低点和高级价格行为分析,检测并可视化高概率订单区块区域。
无论您是经验丰富的交易者还是正在提升交易优势,OBScope™都能为您提供机构足迹的清晰视图——智能资金留下的印记所在。
🔍 主要特点:
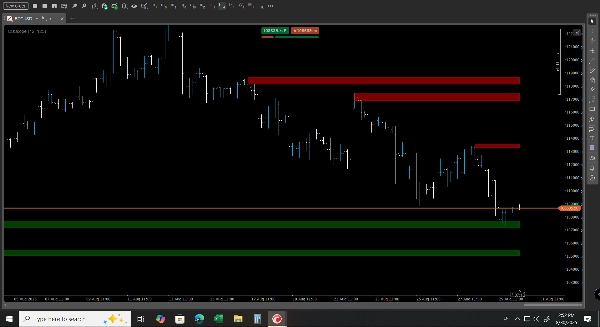
• 动态订单区块检测
自动识别并绘制价格历史上反转或盘整的区域,利用波段结构和基于成交量的逻辑。
• 高概率交易区域
过滤噪音,仅突出显示统计上最显著的订单区块——那些具有验证反应历史和最佳风险回报设置的区域。
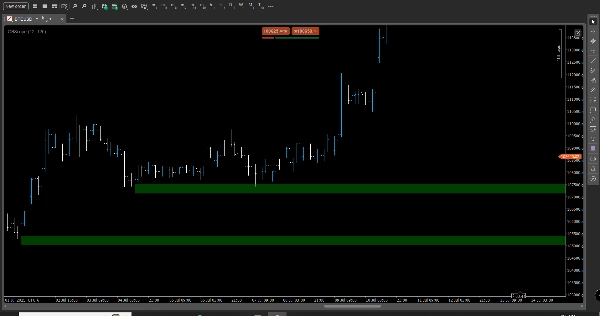
• 基于波段的逻辑
整合波段高点/低点分析,将区域锚定在有意义的市场结构中,提升时机把握和方向偏好。
• 性能驱动设计
基于经过实盘验证的算法构建,OBScope™在多个资产类别和时间框架中表现稳定。
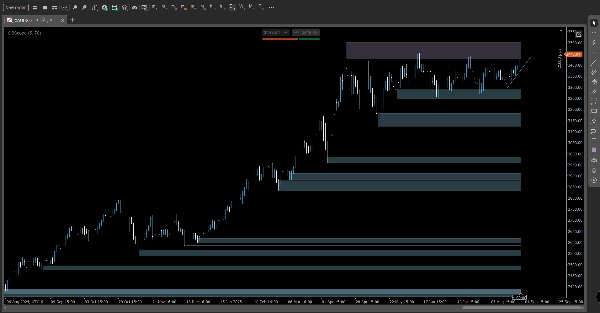
• 可定制的可视化
简洁模块化的用户界面,支持调整区域不透明度和颜色编码——适合主观和算法交易流程。
📈 交易者为何喜爱OBScope™:
• 减少区域识别中的猜测
• 增强与其他策略的融合(例如流动性扫荡、不平衡填充)
• 支持突破和反转设置
• 适合剥头皮、波段交易和自营交易挑战
摘要
指标配置
客户评价
5.0
评价:2
5 | 100 % | |
4 | 0 % | |
3 | 0 % | |
2 | 0 % | |
1 | 0 % |
客户评价
September 10, 2025
September 9, 2025
Two sessions say more than one clean chart, and it adds a useful layer without forcing action.
讨论
常见问答
Prop
Forex
Indices
Commodities
Crypto
Stocks
cTrader Store 提供的所有产品,包括交易机器人、指标和插件,均由第三方开发者提供,仅供信息参考和技术访问之用。cTrader Store 并非经纪商,不提供投资建议、个人推荐或任何未来业绩保证。


价格
25
销售
2.1K
免费安装