
说明
一个根据市场状况动态调整的波动率自适应趋势跟踪指标。
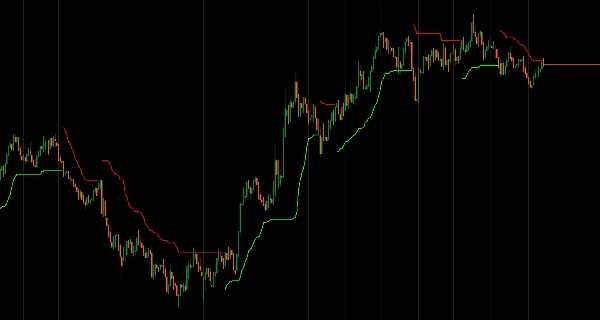
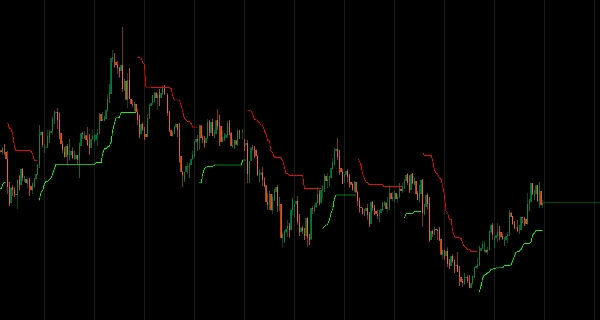
该指标创建智能追踪止损,在市场平稳时自动收紧,在波动剧烈时扩大。与静态追踪止损不同,它根据实时波动率、趋势强度和市场状态调整距离。
主要特点:
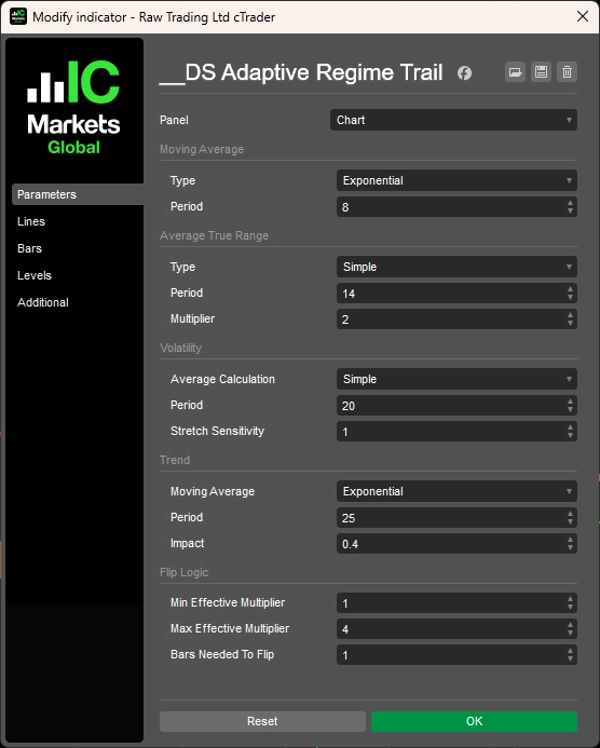
- 智能波动率适应:使用基于ATR的波动率测量自动调整追踪宽度
- 状态检测:通过确认逻辑识别牛市/熊市趋势,过滤虚假信号
- 趋势记忆:结合方向动量,在强趋势期间扩大追踪范围
- 清晰视觉显示:仅显示活动追踪(牛市或熊市),保持图表整洁
- 高度可定制:完全控制移动平均类型、灵敏度和确认要求
工作原理:
该指标结合了三个自适应组件:
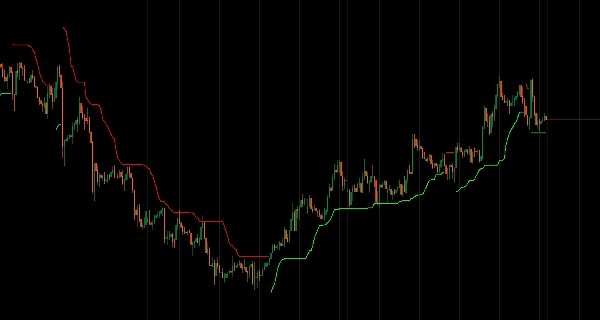
- 波动率拉伸 - 当当前波动率超过平均值时扩大追踪范围
- 趋势增强 - 在强烈的方向性移动期间增加缓冲空间
- 状态确认 - 需要指定的柱数确认趋势反转,减少震荡信号
非常适合希望获得动态支撑/阻力水平的交易者,这些水平尊重市场结构而非任意距离。
原创概念和方法改编自TradingView的“Trend Following Volatility Trail”,作者为HDAlgos。
摘要
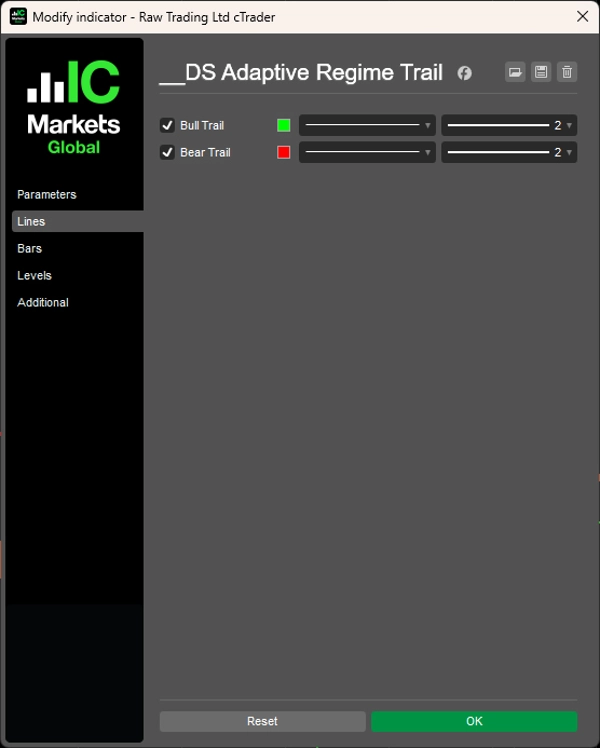
指标配置
客户评价
0.0
评价:0
客户评价
该产品尚无评价。已经试过了?抢先告诉其他人!
讨论
常见问答
Breakout
cTrader Store 提供的所有产品,包括交易机器人、指标和插件,均由第三方开发者提供,仅供信息参考和技术访问之用。cTrader Store 并非经纪商,不提供投资建议、个人推荐或任何未来业绩保证。


价格
注册日期 20/12/2024
8.31K
免费安装