说明
ATR高级波动率与趋势系统
标准的平均真实波幅(ATR)是衡量市场波动性的绝佳工具,但在其默认形式下,它只是一个单一且难以解读的线条。它告诉你波动性是高还是低,但不会告诉你如何交易。
ATR高级版将这一基本指标转变为完整的可视化交易系统。通过引入波动率信号线、方向性彩条和动量直方图,它不仅告诉你市场何时移动,还准确显示当前趋势背后的动力有多强。
完整版的主要功能:
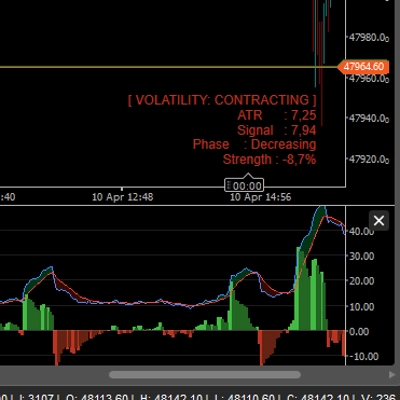
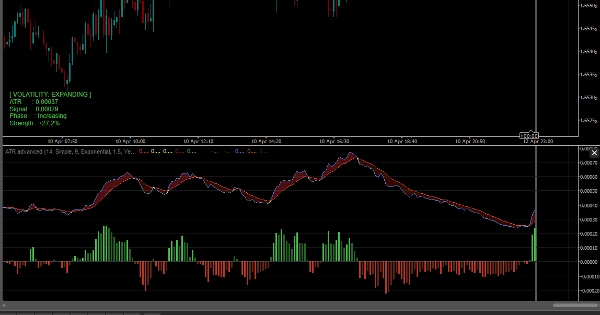
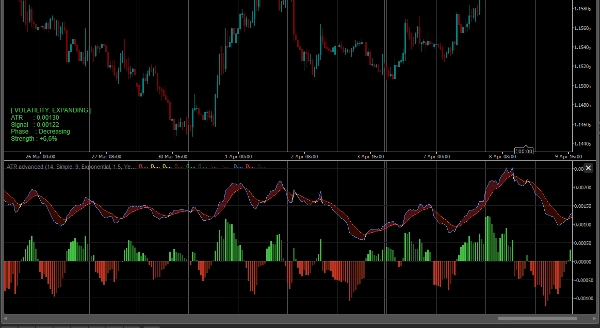
- 波动率扩展云: 我们在ATR中添加了一个移动平均线(信号线)。ATR与其信号线之间的空间被动态云层填充。
-
- 绿色云(扩展):波动率正在增加。市场正在苏醒,趋势强劲。
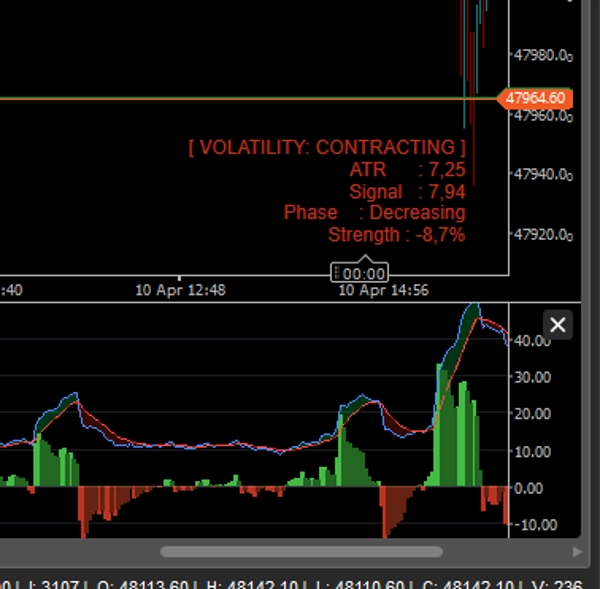
- 红色云(收缩):波动率正在减弱。市场处于盘整或震荡状态。
- 动量直方图: 底部的自定义直方图跟踪ATR与信号线之间的精确差异,帮助你在波动性突破完全显现之前发现它们。
- 智能柱状颜色(方向 + 波动率): 这是终极功能。指标同时读取价格方向(看涨/看跌)和波动率状态,按此为你的蜡烛图着色:
-
- 亮绿色/红色:强趋势 + 波动率扩展(适合突破和趋势交易)。
- 深绿色/红色:弱趋势 + 波动率收缩(警告:动量正在减弱)。
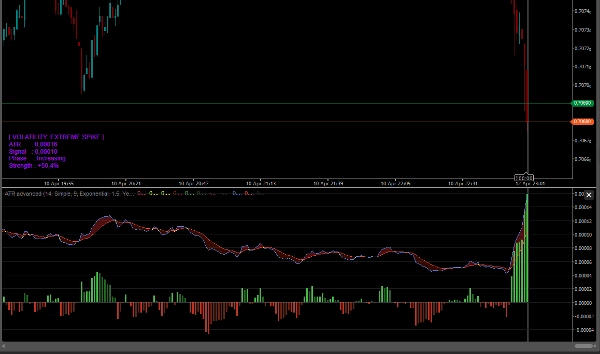
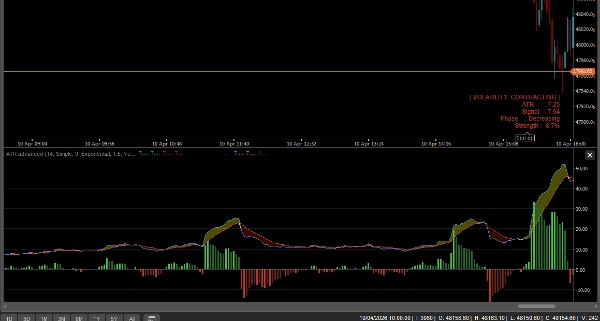
- 极端波动率检测: 当ATR异常飙升(例如,在重大新闻事件或顶部爆发时),蜡烛图变为紫色(极端),提醒你可能出现顶点或大规模突破。
- 实时信息面板: 一个简洁的图表面板显示准确的ATR值、波动率阶段(扩展/收缩)和百分比强度读数。
- 完全解锁: 可在任何品种(外汇、加密货币、指数、股票)和任何时间框架上交易,无任何限制。终身访问权限。
如何使用它进行交易?
- 突破交易: 避免在波动率云为红色(收缩)时交易。等待ATR上穿信号线(云变绿)且蜡烛图呈现亮绿色或亮红色。这确认了一个真正的高概率突破。
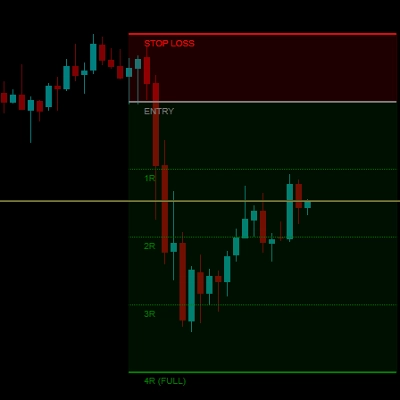
- 移动止损: 只要波动率云保持绿色,就继续持有盈利交易。一旦其下穿变红,意味着动量耗尽——这是获利了结的好时机。
- 顶点警告: 如果你处于趋势中,蜡烛图突然变为紫色,请小心!这代表极端波动率激增,通常发生在趋势末端,紧接着是急剧反转。
摘要
指标配置
指标分类
动量
输出类型
可视化
信号
过滤器
数据要求
仅 K 线
支持的信号
趋势强度
波动性
客户评价
4.5
评价:2
5 | 50 % | |
4 | 50 % | |
3 | 0 % | |
2 | 0 % | |
1 | 0 % |
客户评价
April 18, 2026
3 percent DD is the line to watch, and the log becomes easier to read.
讨论
常见问答
ATR
Moving Average
cTrader Store 提供的所有产品,包括交易机器人、指标和插件,均由第三方开发者提供,仅供信息参考和技术访问之用。cTrader Store 并非经纪商,不提供投资建议、个人推荐或任何未来业绩保证。


价格
24
销售
710
免费安装