present
注册即可在首次购物时获得 $50 优惠
Trading product for Clean Trade Optimization Line Pro 指标 Supertrend, image 1
Clean Trade Optimization Line Pro
指标
版本 1.0, Aug 2026
Windows 版、Mac 版
Trading product for Clean Trade Optimization Line Pro 指标 Supertrend, image 2
Trading product for Clean Trade Optimization Line Pro 指标 Supertrend, image 3
Trading product for Clean Trade Optimization Line Pro 指标 Supertrend, image 4
Trading product for Clean Trade Optimization Line Pro 指标 Supertrend, image 5
注册日期 23/07/2026

说明

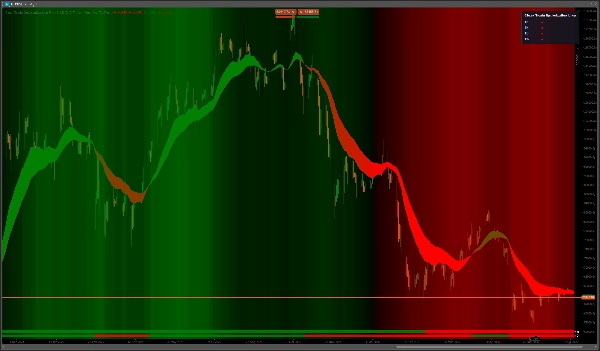
看到市场状态,而非市场噪音。


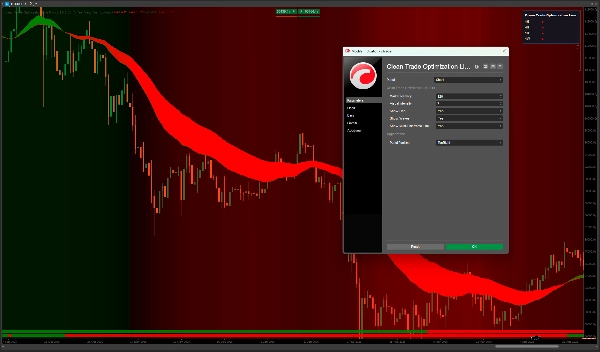
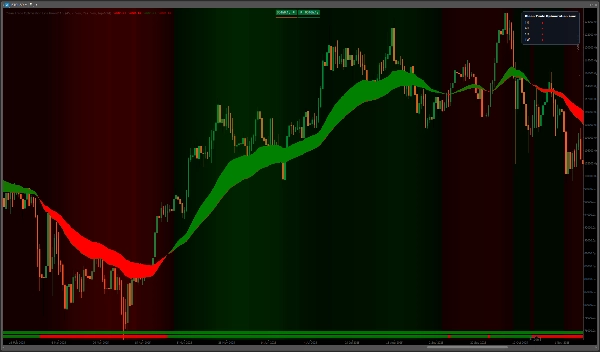
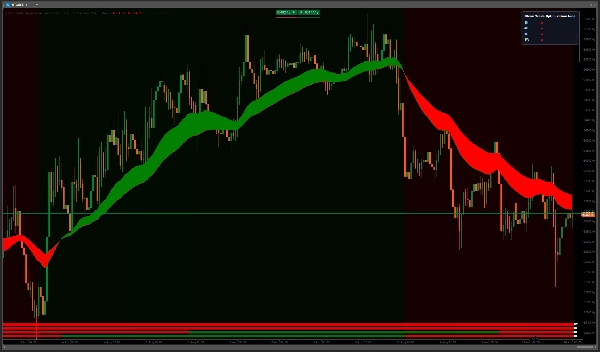
Clean Trade Optimization Line Pro 将复杂的价格行为转化为清晰、高级的视觉体验,专为专注而设计。


方向带使市场特征的变化立即可见。平滑的背景波浪增加了更广泛的背景而不显杂乱,多时间框架视图让整体情况尽在掌握。历史状态栏与图表直接对齐,帮助您看到市场背景如何随着价格演变。


界面保持刻意简洁。将 Clean Trade Optimization Line Pro 添加到图表中,选择您喜欢的视觉强度,专注于重要内容。


Clean Trade Optimization Line Pro 在 1D 时间框架的 BTC 上表现出色,主要市场转变可以清晰地观察到。


亮点


• 高级带状可视化

• 平滑的多头和空头市场背景

• 多时间框架状态概览

• 与图表对齐的历史背景

• 简洁、专注的界面

• 非重绘的历史呈现

• 专为 cTrader 指标设计


更少噪音。更多背景。更好专注。


价格:99 美元 — 一次性购买。促销价 75 美元


Clean Trade Optimization Line Pro 仅为技术分析指标。它不预测未来市场表现,也不保证利润或交易成功。


谨慎交易。管理风险。

摘要

AI 摘要
Clean Trade Optimization Line Pro is a technical analysis indicator designed exclusively for the cTrader platform. It provides a premium visual representation of market regimes, focusing on clarity by filtering out market noise. The indicator features a directional ribbon that highlights changes in market character, smooth background waves to convey bullish and bearish context, and a multi-timeframe status overview to maintain awareness of broader market conditions. Historical status bars aligned with the price chart allow users to track how market context has evolved over time. Its interface is intentionally simple, enabling users to adjust visual intensity and focus on relevant market information. The indicator is optimized for use with Bitcoin (BTC) on the daily (1D) timeframe, where it helps identify major market transitions with enhanced clarity. It offers non-repainting historical data presentation to support reliable analysis. Key features include premium ribbon visualization, smooth market context waves, multi-timeframe overview, chart-aligned historical context, and a clean, focused interface. This product is categorized under trend indicators and supports visualization and signal outputs, including cross signals, based on bar data inputs.
指标配置
指标分类
趋势
输出类型
可视化
信号
数据要求
仅 K 线
支持的信号
交叉

客户评价

0.0
评价:0
客户评价
该产品尚无评价。已经试过了?抢先告诉其他人!

讨论

常见问答

Supertrend
cTrader Store 提供的所有产品,包括交易机器人、指标和插件,均由第三方开发者提供,仅供信息参考和技术访问之用。cTrader Store 并非经纪商,不提供投资建议、个人推荐或任何未来业绩保证。

猜您喜欢

指标
EMA
Forex
+5
ALMA Smoothed Gaussian Moving Average (ASGMA) – by LudwigICT
指标
BOS
Order Block
+3
Not every order block deserves your attention.
指标
Forex
Identify 34 candlestick patterns, track trends across timeframes, and get instant alerts with this powerful trading tool
指标
RSI
VWAP
+5
Turtle Soup ICT Strategy – Detect liquidity traps & trade smart money moves with precision on cTrader.
指标
AI
RSI
+7
EMA MTF TREND PRO - Multi-timeframe trend analysis overlay indicator, 6 timeframes - in one table with ADX
指标
Forex
BTCUSD
+5
Cross EMA Pro – Trend Reversal Indicator
指标
MSS
Inducement
+5
ICT Core is a non-repainting Smart Money Concepts indicator
指标
Volume
Moving Average
Multi-Timeframe Rolling Volatility Indicator - Smart Volatility Breakout System
指标
Forex
Crypto
+5
📈 Initial Balance Breakout Signals: visually accurate IB levels, breakout alerts & forecast zones for smart trading.
指标
AI-assisted
Predictive Monte Carlo Engine Forecast future price paths using institutional-grade statistical models and probability
指标
Order Block
Supply & Demand
+2
Professional MTF dashboard aggregating and clustering Supply & Demand zones from multiple timeframes in cTrader.
指标
Double Top
Key Levels
+5
Indicator acts as a dynamic target identification engine based on SMC and ICT. Detects,ranks,and tracks liquidity pools.
指标
Forex
BTCUSD
+12
Pro Structure Patterns Detector
指标
Forex
Crypto
+5
This indicator combines two independent analytical engines into a single overlay on your chart.
指标
Forex
Indices
+1
Detects HTF bias using CRT, Expansion & Swing Point patterns with SMT/PSP divergence — visualised in a floating candle
指标
EMA
Plots one value from -1 to +1 blending an EMA trend score with a mean-reversion state by volatility regime.
指标
VWAP
Volume
+4
Volume Profile + VWAP with Standard Deviations
指标
VWAP
Volume
+3
Track hidden trading activities to be on the right side of the market.

价格

注册日期 23/07/2026