

present
注册即可在首次购物时获得 $50 优惠
Trading product for Voidbreak Buy Sell Pro 指标 ADX EMA, image 1
Voidbreak Buy Sell Pro
指标
版本 1.0, Sep 2026
Windows 版、Mac 版
Trading product for Voidbreak Buy Sell Pro 指标 ADX EMA, image 2
Trading product for Voidbreak Buy Sell Pro 指标 ADX EMA, image 3
Trading product for Voidbreak Buy Sell Pro 指标 ADX EMA, image 4
Trading product for Voidbreak Buy Sell Pro 指标 ADX EMA, image 5
Trading product for Voidbreak Buy Sell Pro 指标 ADX EMA, image 6
Trading product for Voidbreak Buy Sell Pro 指标 ADX EMA, image 7
Trading product for Voidbreak Buy Sell Pro 指标 ADX EMA, image 8
Trading product for Voidbreak Buy Sell Pro 指标 ADX EMA, image 9
Trading product for Voidbreak Buy Sell Pro 指标 ADX EMA, image 10
Trading product for Voidbreak Buy Sell Pro 指标 ADX EMA, image 11

说明

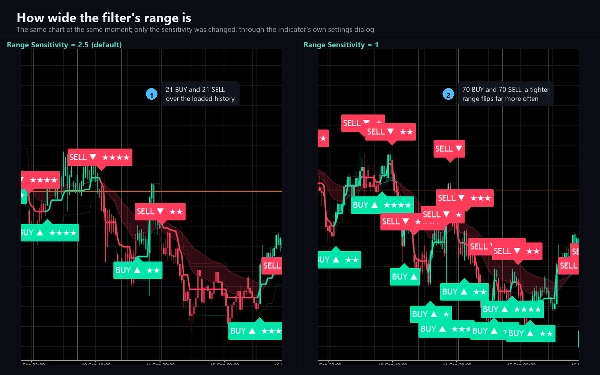
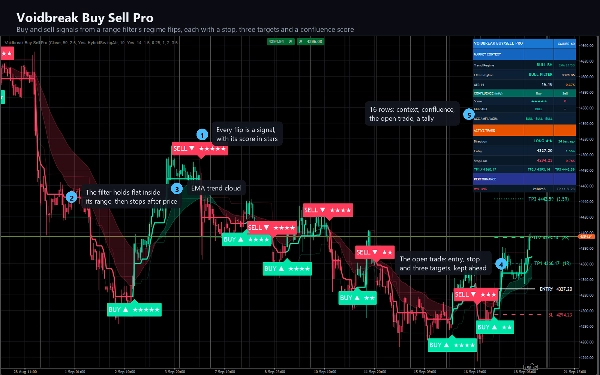
Voidbreak Buy Sell Pro draws a range filter: a line that holds still while price moves inside a

smoothed range of it, and steps after price only when price leaves that range. While the line is flat,

nothing happens - that is the void. When price breaks out and the line starts stepping in the new

direction, the regime flips, and the flip is the signal: BUY when it turns bullish, SELL when it

turns bearish. Every signal arrives with a stop, three targets and a score.


WHAT IT DRAWS


- The range filter, three pixels wide, coloured bullish while it steps up and bearish while it steps

down, with a faint band above and below it.

- Candles coloured by the filter's direction - full colour when the candle closes with it, lighter

when it closes against it.

- A trend cloud between a 21 and a 50 EMA, in the colour of whichever is on top. It is display only.

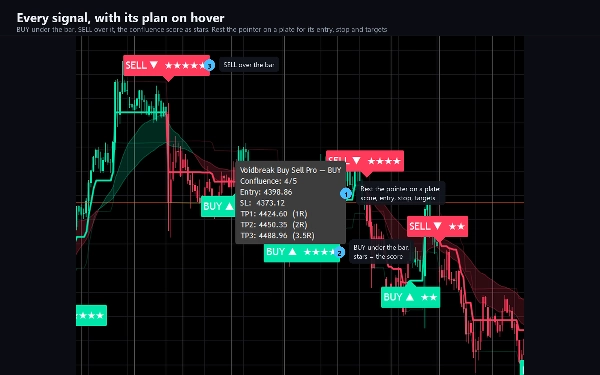
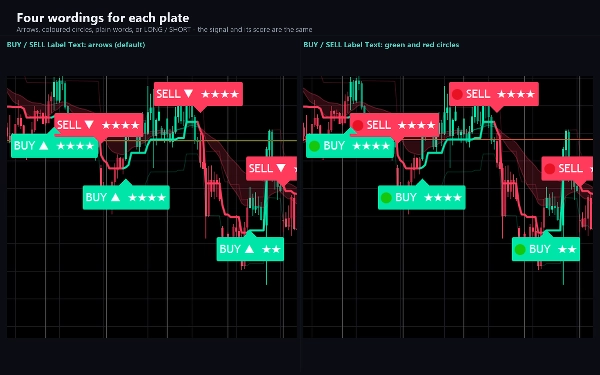
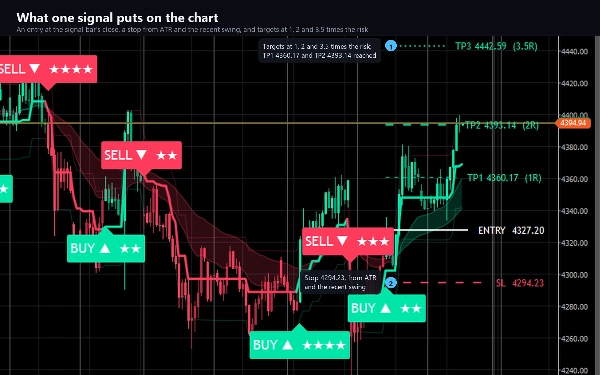
- A plate on every signal bar - BUY below the candle, SELL above it - with the confluence score as stars.

Rest the pointer on a plate to see its score, entry, stop and all three targets.

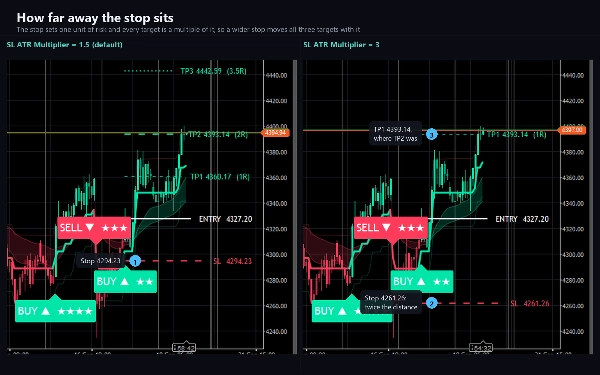
- For the open trade: an entry line, a stop, and three targets at 1, 2 and 3.5 times the risk, each

with a price tag, carried forward bar by bar so they always run ahead of price. When the trade

closes, its lines are removed; the next signal draws a new set.

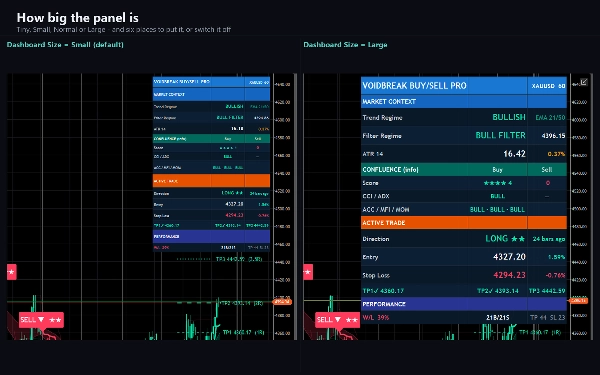
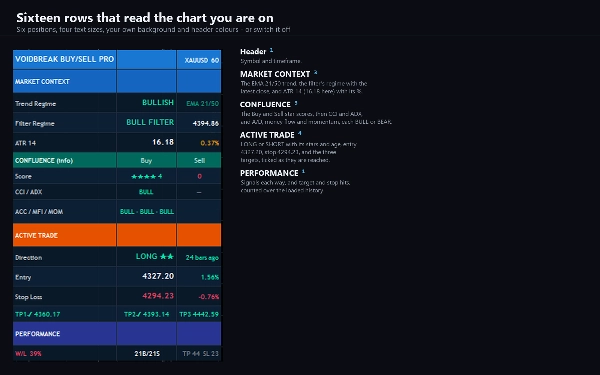
- A sixteen-row panel in four sections: the market context (EMA trend, filter regime, ATR), the

confluence reading for both sides, the active trade with its entry, stop and targets ticked as they

are reached, and a running count of signals, targets reached and stops reached.


HOW IT DECIDES


Only one trade is followed at a time, and it always runs in the direction of the last flip, so every

flip closes the trade before it and opens the other side. A signal is decided when its bar closes and

never moves afterwards. Targets and the stop are checked as the bar forms.


The stop has three modes. Hybrid, the default, uses the tighter of an ATR stop and a stop beyond the

recent swing, whose lookback shrinks on faster charts. Pure ATR uses the ATR stop alone. Recent Swing

uses the swing alone. The risk is never smaller than ten ticks.


The five confluence stars - CCI, ADX with the directional lines, accumulation/distribution, money

flow and a regression of momentum - are information only. They are shown on the plate and in the

panel, and they never hold a signal back. A factor you switch off simply stops scoring.


KEY SETTINGS


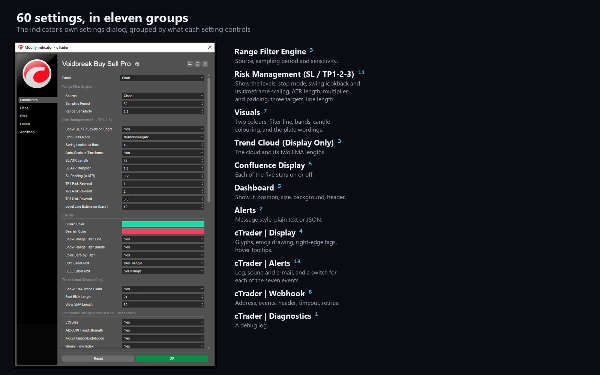
60 in eleven groups. The filter's source, sampling period and sensitivity; the stop mode, swing

lookback and its timeframe scaling, the ATR length, multiplier and padding, three risk-to-reward

targets and how far the level lines run; two colours, the filter line, its bands, candle colouring

and four wordings for each plate; the cloud and its two EMA lengths; each confluence factor on or off;

the panel's position, size, background and header colour; the alert message style; and cTrader groups

for display, alerts, the webhook and diagnostics.


ALERTS AND WEBHOOK


Seven events, each with its own switch: BUY, SELL, either signal, the first, second and third target,

and the stop. Delivered as a cTrader log line, a sound of your choice, and e-mail. A signal alert

carries the entry, the stop, all three targets and the score. Nothing fires while the indicator walks

the chart's history, and nothing fires in a backtest.


A webhook posts signals - and, if you choose, targets and stop events - as JSON to any address you

enter: a trading bot, a journal, a relay, an automation flow. It stays off until you enter one, it is

deduplicated per event per bar, capped at twenty messages a minute, and a failure is logged rather

than thrown. It sends through cTrader's own networking service, which is why the indicator needs no

file or network access rights at all.


TYPE AND WINDOW


An overlay indicator: everything is drawn on the price chart, and it adds no separate pane.


TIMEFRAMES AND INSTRUMENTS


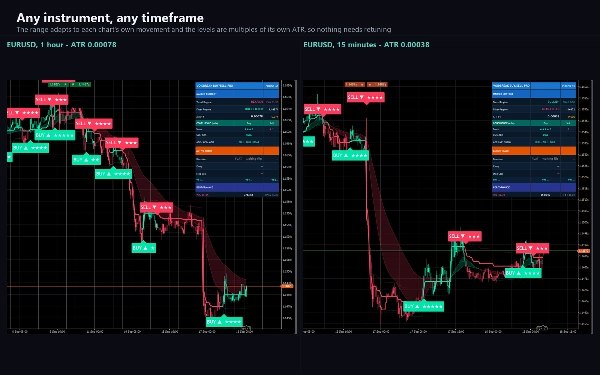
Any. The range adapts to each chart's own movement, the stop and targets are multiples of that

chart's own ATR, and prices are formatted to your broker's own tick, so nothing needs retuning between

a five-minute chart and a daily one, or between a five-decimal pair and gold. The accumulation and

money-flow stars read your broker's tick volume; no signal or level does.


USE CASES


- Following a trend from the moment it breaks out of a quiet range, and standing aside while it is

flat.

- Turning each signal into a plan: one stop and three targets, drawn before you act.

- Reading how much agreement stands behind a signal, from its stars.

- Being told by log line, sound, e-mail or webhook when a signal fires or a target is reached.


WHO IT IS FOR


Traders who want clear buy and sell points that stay quiet in a range, and anyone who wants a signal

to arrive with a stop and a set of targets rather than an arrow.


TRIAL


The free trial is the full indicator on EURUSD only - every broker suffix works. On any other symbol

it shows a notice and draws nothing. No time limit, no reduced history, no missing features. The full

version removes the symbol restriction and changes nothing else.


TECHNICAL NOTES AND LIMITATIONS


Access rights: none. The indicator cannot read files, start processes or open connections of its own.


It is a charting and analysis tool. It does not place orders and it has no access to your account.


The range filter settles over the first few hundred bars of a chart, so load some history before

reading its earliest signals. In Recent Swing mode the swing is read only on signal bars, and on

many buy signals that places the stop very far below the entry. Hybrid, the default, and Pure ATR are

not affected.


The panel's PERFORMANCE row counts what the drawn levels met on the bars your chart has loaded. A stop

reached after the first target counts as a win, and a trade closed by the next flip counts as a win

when it closed at or beyond its entry. It is a description of that history, not a backtest and not a

forecast.


SUPPORT


Questions go through the Discussion tab. Include your broker, symbol, timeframe, cTrader version and

a screenshot of the whole chart, and you will get a useful answer first time.


Trading involves risk. Past performance does not guarantee future results.

摘要

指标配置
指标分类
趋势
输出类型
信号
可视化
数据要求
仅 K 线
支持的信号
反转
突破
趋势强度

客户评价

0.0
评价:0
客户评价
该产品尚无评价。已经试过了?抢先告诉其他人!

讨论

常见问答

ADX
EMA
Key Levels
Volume
ATR
CCI
Support & Resistance
cTrader Store 提供的所有产品,包括交易机器人、指标和插件,均由第三方开发者提供,仅供信息参考和技术访问之用。cTrader Store 并非经纪商,不提供投资建议、个人推荐或任何未来业绩保证。

该作者的其他作品

指标
ATR
CCI
+4
A trend line that never steps back, a shaded band to the price, and a pointer at the swing where the trend turns.
指标
ADX
ATR
+5
SuperTrend signals scored on five confluence factors, with an ATR stop, three targets and a dashboard.
指标
ADX
ATR
+5
Ten confluence layers scored on every closed bar, with an anti-chop gate, pivot levels and a live dashboard.
指标
ATR
RSI
+4
RSI bands drawn on price, confluence-scored BUY/SELL signals, an ATR stop with three targets
指标
Volume
Channel
+3
A higher-timeframe log-regression channel with a volume profile, Point of Control and session levels.
指标
Volume
Key Levels
+1
Fixed-grid volume profile: bull and bear volume at every price level, with Point of Control and value area.
指标
ATR
BOS
+5
Know how strong each Supertrend flip is: scored BUY/SELL, structure stop + 3 targets, live win-rate dashboard, alerts.
指标
ATR
EMA
+3
EMA trend, RSI reclaim and divergence signals with ATR stop and two targets, swing levels and a 16-row dashboard.
指标
ATR
EMA
+2
Eight-EMA ribbon with ATR trade zones, a nine-symbol screener and a five-timeframe trend dashboard.
指标
Key Levels
Order Block
+5
Order blocks, fair value gaps, liquidity sweeps and a 24-timeframe signal scanner on one chart.
指标
ADX
ATR
+5
EMA-cross signals scored on six confluence layers, with an ATR stop, three targets and a live panel
指标
ATR
EMA
+4
Range-filter BUY/SELL signals scored by four confluence layers, with a stop, five targets and a trend panel

猜您喜欢

指标
SMC
Forex
+7
Simple Smart Money Concepts (SMC)
指标
BOS
Key Levels
+1
Guided by Yahuah Yahusha. 15M: BOS above red (buys)/below green (sells). 4HC reject+BOS. 5M: RBS/SBR. SL wick. TP 1:4.
指标
Forex
BTCUSD
+11
Auto-detects Bullish/Bearish Engulfing patterns to spot trend reversals. Real-time alerts, custom colors, all symbols.
指标
Prop
Forex
+7
The Parabolic SAR, or "Stop and Reverse," is a dynamic technical analysis tool.
指标
AI
ATR
+27
Market Cipher B
指标
ATR
SMC
+2
HTF POWER 3 ICT Power of 3 · M1 Precision · H4 Intelligence Auto-detect Accumulation → Manipulation → Distribution
指标
Volume
Channel
+5
Spots volatility squeezes before they fire — the compression phase everyone else misses.
指标
Prop
Forex
+4
The Smooth Heiken Ashi indicator is a refined charting tool designed to filter out market noise and highlight true price
指标
Pin Bar
Inside Bar
+2
Advanced candlestick pattern recognition with structural quality scoring, alerts and adaptive chart visuals.
指标
Breakout
Allow trader to visualize Support & Resistance across different timeframes,give trader an overview of the current market
指标
AI
ATR
+26
Liquidity Cluster Order automatically detects and draws accumulation zones & distribution zones
指标
ATR
Volume
+3
Fibonacci trend signals on closed bars, with an ATR stop, up to four targets and a break-even ladder.
指标
Prop
Forex
+4
Automatic Support/Resistance zones from swing points.
指标
MSS
Key Levels
+2
Simple Support and Resistance automatically calculates key price structure. plots clean minimal S/R lines, no clutter
指标
ATR
BOS
+3
Fair Value Gaps with Multi-Timeframe.
指标
Signal
Breakout
+1
Bolliger Bands + Hamster-Coder™ Timeframe Decoupling
指标
Volume
Order Block
+4
Advanced Pro Volume Profile: Double Back-to-Back, Institutional Dynamic, Fixed Range & Order Flow
指标
ATR
MACD
+15
BrickAlgo TrendPulse is an advanced technical analysis tool that combines multiple indicators with filterin mechanisms.

价格

3
销售





























