
Açıklama
Taiz Pro Volume Profile: Piyasa Niyetlerini Ortaya Çıkaran Nihai Analiz Aracı
Gecikmeli göstergelere güvenmekten bıktınız mı, size tam resmi vermeyen? Taiz Pro Volume Profile göstergesi sadece başka bir araç değil, piyasada "perde arkasında" olanları görmenizi sağlayan pencerenizdir.
Geleneksel hacim göstergelerinin "ne zaman" işlem yapıldığını gösterdiğinin aksine, bu gösterge "nerede" işlem yapıldığını ortaya koyar ve size gerçek bir rekabet avantajı sağlar.
---
· Bu gösterge size ne sunar?
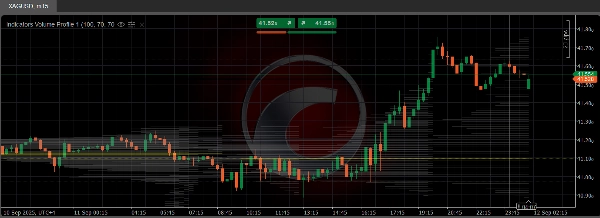
o 📈 Yüksek Likidite Bölgelerinin Belirlenmesi: En büyük işlem hacimlerinin yoğunlaştığı fiyat seviyelerini keşfedin. Burası piyasa yapıcıları ve büyük kurumların savunduğu alanlardır.
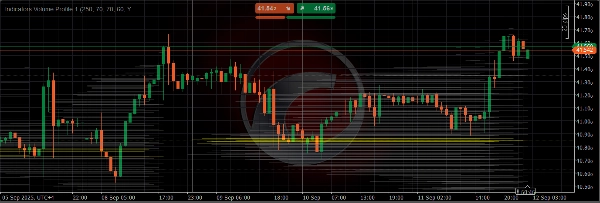
o 🎯 Kontrol Noktası (Point of Control - POC):* Gösterge, en yüksek işlem hacminin gerçekleştiği fiyat seviyesini (sarı çizgi ile) net bir şekilde gösterir. Bu seviye fiyat için bir mıknatıs ve çok önemli bir destek veya direnç bölgesidir.
o 📊 Değer Alanı (Value Area - VA): İşlemlerin %70'inin gerçekleştiği fiyat aralığını (gri renk ile) belirler. Bu bölgenin üzerinde işlem yapmak güçlü bir yükseliş sinyali, altında işlem yapmak ise düşüş sinyalidir.
o 💡 Daha Akıllı İşlem Kararları: Bu bölgeleri kullanarak giriş noktalarını yüksek doğrulukla belirleyin, zarar durdurma emirlerini güvenli yerlere koyun ve gerçekçi kar hedefleri belirleyin.
---
· Neden bu gösterge daha iyi?
o Üstün Hesaplama Doğruluğu: Her fiyat hareketine hacmi hassas şekilde dağıtmak için gelişmiş bir algoritma kullanır, böylece daha gerçekçi sonuçlar verir.
o Kullanım Kolaylığı: Basit bir arayüz ve net ayarlar, göstergenizi analiz tarzınıza göre özelleştirmenizi sağlar.
o Kararlı Performans: Kod, cTrader platformunuzu yavaşlatmayacak şekilde hafif ve kararlı olacak şekilde tasarlanmıştır.
Teknik analizlerinizi bir sonraki seviyeye taşıyın. Sadece tahminlere değil, gerçek verilere dayalı işlem yapmaya başlayın. Göstergeyi şimdi indirin.
Özet
Key features include:
- High liquidity zones: Identifies price levels with the largest traded volumes, often defended by market makers and institutions.
- Point of Control (POC): Marks the price level with the highest volume using a yellow line, serving as a critical support or resistance area.
- Value Area (VA): Displays the price range where 70% of trading volume occurred, shaded in gray; trading above this area suggests bullish momentum, while below indicates bearish signals.
- Precision trading decisions: Helps users pinpoint entry points, set stop-loss orders safely, and establish realistic profit targets.
The indicator employs an advanced algorithm for accurate volume distribution across price movements, ensuring realistic results. It features a user-friendly interface with customizable settings and is optimized for stable, lightweight performance on the cTrader platform.
Applicable markets include Forex, indices, commodities, stocks, and cryptocurrencies, supporting symbols like EURUSD, GBPUSD, XAUUSD, BTCUSD, NAS100, and others. This tool aids traders in making data-driven decisions based on volume profile analysis.
Müşteri değerlendirmeleri
5 | 33 % | |
4 | 67 % | |
3 | 0 % | |
2 | 0 % | |
1 | 0 % |


















