ADX advanced
Gösterge
Sürüm 1.0, Apr 2026
Windows, Mac
4.3
Değerlendirmeler: 3
Açıklama
ADX Gelişmiş Bulut ve Momentum Sistemi
Standart Ortalama Yön Endeksi (ADX) güçlü bir araçtır, ancak dürüst olalım: üç kesişen çizgiye (+DI, -DI ve ADX) bakmak karmaşık, kafa karıştırıcı ve gözlerinizi yoruyor.
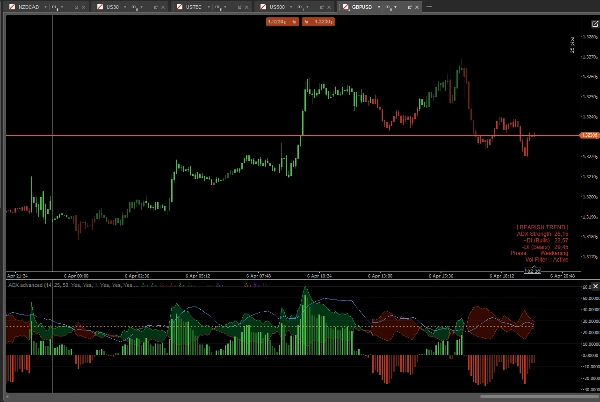
ADX Gelişmiş Gösterge bu klasik aracı tamamen modernize eder. Kaotik çizgileri, kimin kontrolü elinde tuttuğunu (Boğalar vs. Ayılar) ve trendin ne kadar güçlü olduğunu tek bir bakışta gösteren net, görsel bir güç merkezine dönüştürür.
Temel Özellikler
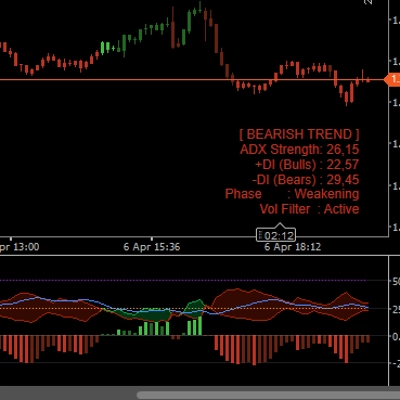
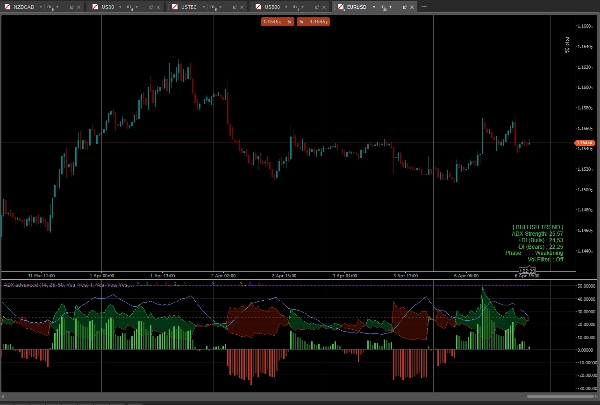
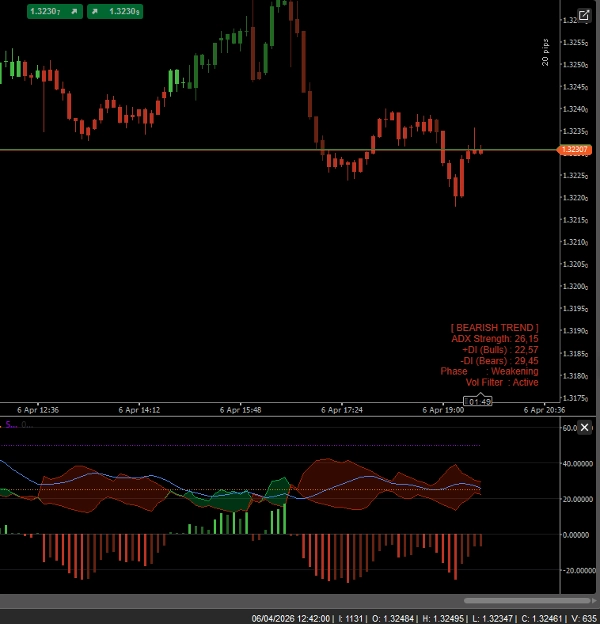
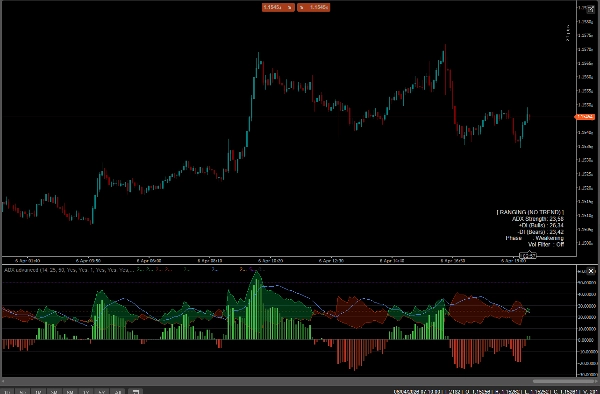
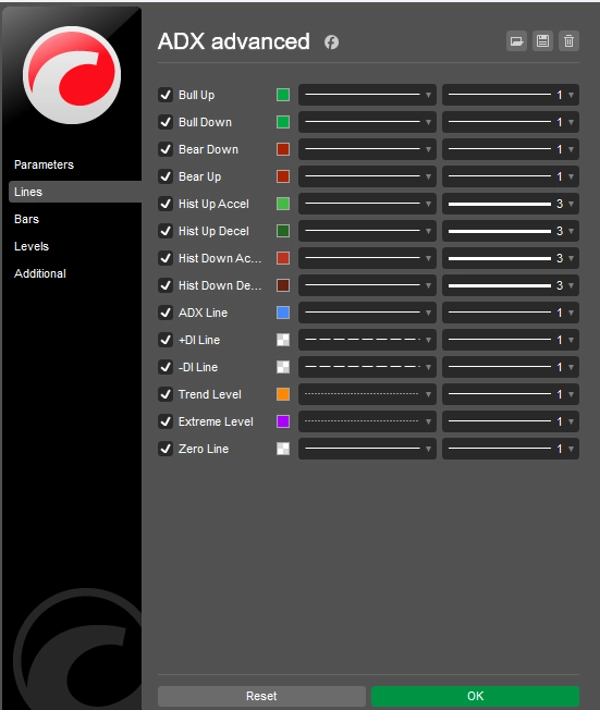
- Yön Bulutları (DI Bulutu): Çizgilerin kesişmesi yerine, +DI ve -DI arasındaki alan dinamik bir renk bulutuyla doldurulur. Yeşil Bulut = Boğalar kontrolü elinde tutuyor. Kırmızı Bulut = Ayılar kontrolü elinde tutuyor.
- Momentum Histogramı: Gösterge altındaki özel yapım histogram, +DI ve -DI arasındaki tam mesafeyi ölçer. Hızlanma/yavaşlama renkleri içerir, böylece trend gerçekten tersine dönmeden önce azalan momentumu fark edebilirsiniz.
- Akıllı Çubuk Renklendirme (Paintbars): Gösterge, trend gücüne göre fiyat mumlarınızı doğrudan boyar!
-
- Parlak Yeşil/Kırmızı: Güçlü Trend (ADX > 25 ve +DI/-DI uyumu)
- Koyu Yeşil/Kırmızı: Zayıf Trend / Aralıkta (ADX < 25)
- Mor/Magenta: Aşırı Uzamış Trend (ADX > 50) - Geri çekilmeye hazırlanın!
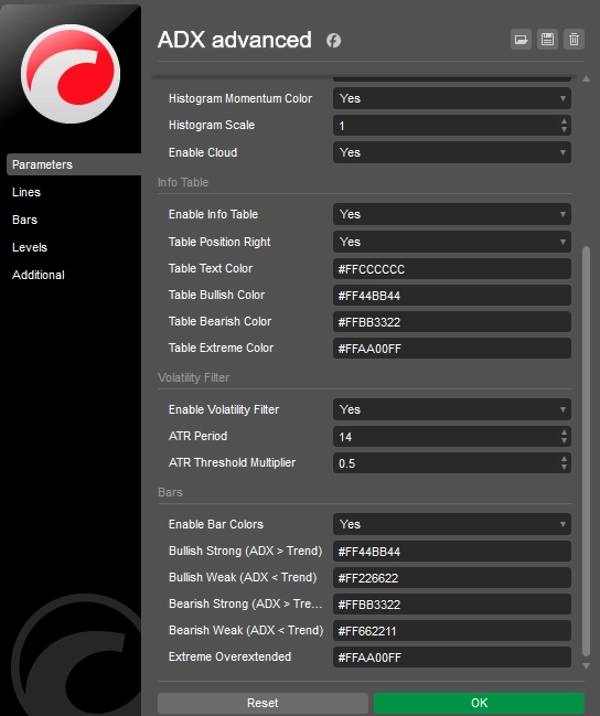
- Grafik Üzerinde Bilgi Paneli: Şık, müdahale etmeyen bir gösterge paneli mevcut Piyasa Durumunu (Trend, Aralık, Aşırı), ADX Gücünü ve Momentum Fazını gerçek zamanlı olarak gösterir.
- Dahili Volatilite Filtresi (ATR): Piyasa tamamen yatay olduğunda mumları ve histogram çubuklarını griye çeviren isteğe bağlı ATR filtresi, sizi dalgalı piyasalarda işlem yapmaktan korur.
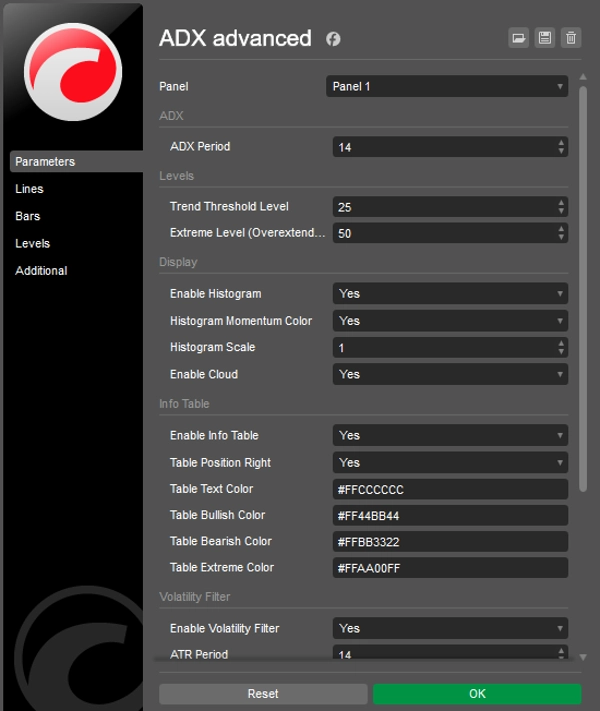
- Tamamen Özelleştirilebilir: Renkleri, eşik değerleri (Trend seviyesi 25, Aşırı seviye 50) ve histogram ölçeklendirmesini kişisel işlem stilinize ve grafik temasına uyacak şekilde değiştirebilirsiniz.
Nasıl kullanılır?
- ADX mavi çizgisinin 25 Eşik değerini yukarı kesmesini bekleyin (Trend aktif).
- Yönü onaylamak için Bulut ve Histogram’a bakın (Uzun için Yeşil, Kısa için Kırmızı).
- Kırılmaları işlem yapın ve mumlar "Güçlü" renklerde boyandığı sürece trendi takip edin.
- ADX çizgisi 50 Aşırı Seviyeyi geçtiğinde (mumlar morya döner) kar alabilir veya stopları takip edebilirsiniz.
Özet
Gösterge profili
Müşteri değerlendirmeleri
4.3
Değerlendirmeler: 3
5 | 33 % | |
4 | 67 % | |
3 | 0 % | |
2 | 0 % | |
1 | 0 % |
Müşteri değerlendirmeleri
April 16, 2026
April 12, 2026
Tartışma
SSS
BTCUSD
Forex
Signal
Indices
EURUSD
Commodities
GBPUSD
NZDUSD
Prop
XAUUSD
NAS100
ATR
USDJPY
cTrader Store üzerinden erişilebilen işlem botları, göstergeler ve eklentiler gibi ürünler, üçüncü taraf sağlayıcılar tarafından sağlanır ve yalnızca bilgilendirme ve teknik erişim amaçlarıyla sunulur. cTrader Store bir broker değildir ve yatırım tavsiyesi, kişisel öneriler vermez veya gelecekteki performansı garanti etmez.


!["Smart Money Concepts (SMC) [Iridio Capital]" logosu](https://cdn.ctrader.com/image/webp/28b69fd1-ef54-4bed-9487-07e78e883be4_40934)


Fiyat
24
Satışlar
677
Ücretsiz yüklemeler