Descrição
O Oscilador de Linhas de Tendência ajuda os traders a identificar tendências e momentum com base nas distâncias normalizadas entre o preço atual e as linhas de tendência de alta e baixa detectadas mais recentemente.
O indicador apresenta momentum de alta e baixa, uma linha de sinal com cruzamentos e múltiplas opções de suavização.
USO
O Oscilador de Linhas de Tendência funciona sistematicamente:
- Identificando pontos altos e baixos pivôs.
- Conectando pivôs para formar linhas de tendência de alta (suporte) e baixa (resistência).
- Medindo a distância (delta) entre o preço atual e essas linhas de tendência.
- Normalizando essas distâncias entre 0 e 100 para criar valores de momentum.
- Suavizando os valores para sinais mais claros.
- Gerando sinais de alta e baixa quando o momentum cruza a linha de sinal.
O oscilador exibe três linhas principais:
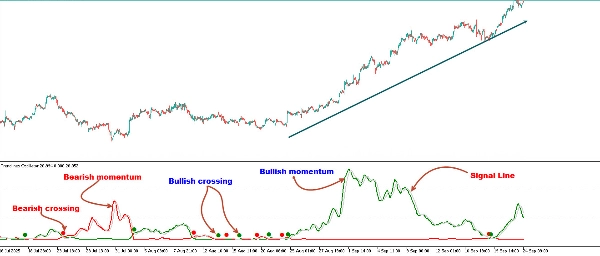
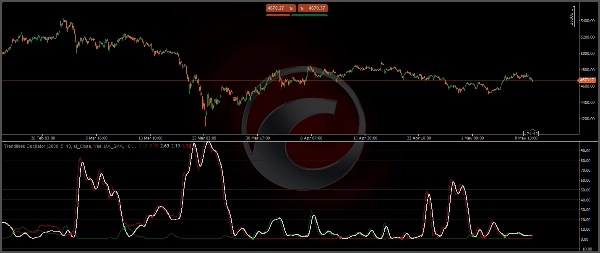
Linha de Momentum de Alta (Verde): Mede a força dos compradores calculando o quão longe o preço está das linhas de suporte de alta recentes.
Linha de Momentum de Baixa (Vermelha): Mede a força dos vendedores calculando o quão longe o preço está das linhas de resistência de baixa recentes.
Linha de Sinal (Cinza): Fornece cruzamentos com as linhas de momentum para destacar oportunidades potenciais de negociação.
Como regra geral, quando a linha de momentum de alta está acima da linha de momentum de baixa, isso indica força dos compradores. Isso significa que os preços reais estão mais distantes das linhas de suporte do que das linhas de resistência. O oposto é verdadeiro para a força dos vendedores.
Para calcular o momentum de alta, a ferramenta primeiro identifica linhas de tendência de alta que atuam como suporte abaixo do preço. Em seguida, mede o delta entre o preço e essas linhas de tendência e normaliza a leitura nos valores de momentum exibidos.
O mesmo processo é usado para o momentum de baixa, mas com linhas de tendência de baixa atuando como resistência acima do preço.
Comprimento & Memória
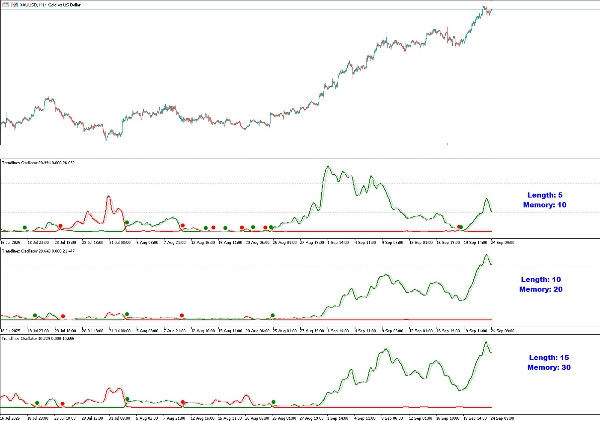
- Comprimento: Determina o tamanho da estrutura de mercado usada para detectar linhas de tendência. Valores maiores capturam tendências mais amplas, enquanto valores menores tornam a ferramenta mais sensível a movimentos de curto prazo.
- Memória: Controla quantas linhas de tendência são consideradas nos cálculos. Valores de memória maiores suavizam os sinais para análise de longo prazo, enquanto valores menores oferecem reações mais rápidas.
Modificar os valores de Comprimento e Memória fará com que a ferramenta exiba diferentes valores de momentum.
Os traders podem ajustar o comprimento para detectar linhas de tendência maiores e ajustar a memória para indicar quantas linhas de tendência a ferramenta deve considerar.
Como o gráfico acima mostra, valores menores tornam a ferramenta mais responsiva, enquanto valores maiores são úteis para detectar tendências maiores.
Suavização
- Suavização de Dados: Aplica suavização aos valores brutos de momentum.
- Suavização do Sinal: Suaviza a própria linha de sinal para pontos de cruzamento mais claros.
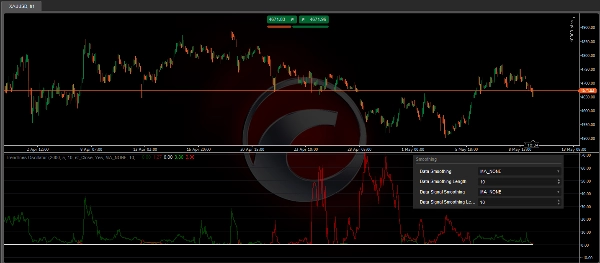
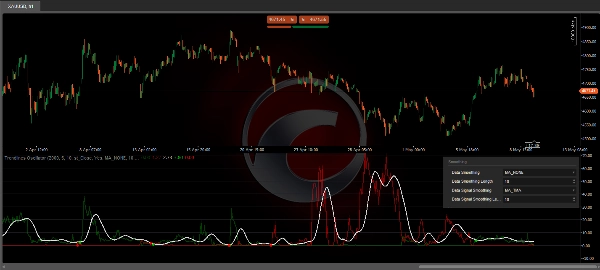
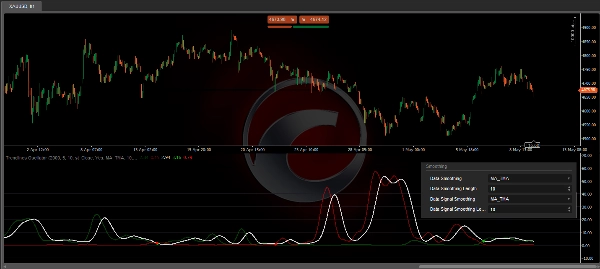
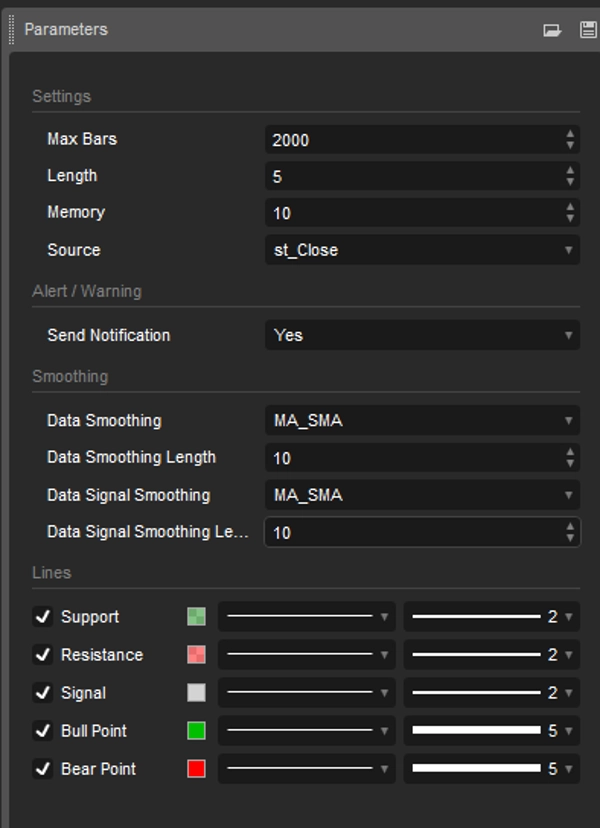
Por padrão, os dados são suavizados por SMA, e o sinal usa uma média móvel triangular com comprimento 10. Os traders podem suavizar tanto os dados quanto a linha de sinal.
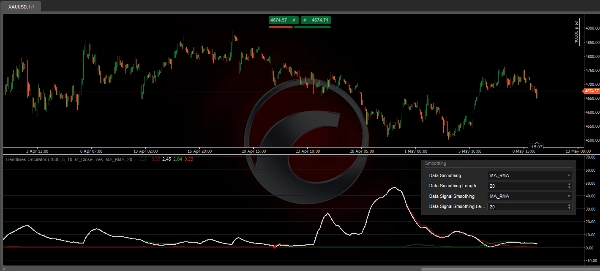
Os traders podem escolher diferentes métodos, ou nenhum. Alguns exemplos são mostrados nas imagens anexadas.
CONFIGURAÇÕES
- Comprimento: O tamanho da estrutura de mercado usada para detecção de linhas de tendência.
- Memória: O número de linhas de tendência usadas nos cálculos.
- Fonte: A fonte para os cálculos é o preço de fechamento por padrão.
- Suavização de Dados: Escolha o método e o comprimento da suavização
- Suavização do Sinal: Escolha o método e o comprimento da suavização
- Alerta: Alerta/Notificação quando ocorrer cruzamento de alta/baixa
- Estilos: Ajuste a cor, estilo, largura das linhas de Suporte/Resistência/Sinal
O indicador de negociação Oscilador de Linhas de Tendência é ideal para traders que desejam:
- Uma visão baseada em linhas de tendência do momentum em vez de depender apenas de médias móveis ou RSI.
- Cruzamentos visuais claros para sinalizar entradas e saídas potenciais.
- Suavização personalizável para adaptação a diferentes estilos de negociação.
- Uma ferramenta que destaca a dominância de compradores versus vendedores em tempo real.
- Ao combinar análise estrutural de mercado com cálculos de momentum, esta ferramenta oferece uma vantagem única para identificar tanto oportunidades de continuação quanto de reversão de tendência.
Resumo
Users can customize the indicator’s sensitivity and responsiveness by adjusting the Length (market structure size for trendline detection) and Memory (number of trendlines considered). The tool also offers data and signal smoothing options using various methods, including SMA and triangular moving averages, to provide clearer signals. The Trendlines Oscillator supports alerts for bullish and bearish crossovers and allows customization of line styles and colors. It provides a structural market analysis combined with momentum calculations to help traders assess buyer versus seller dominance and identify trend continuation or reversal opportunities.