

説明
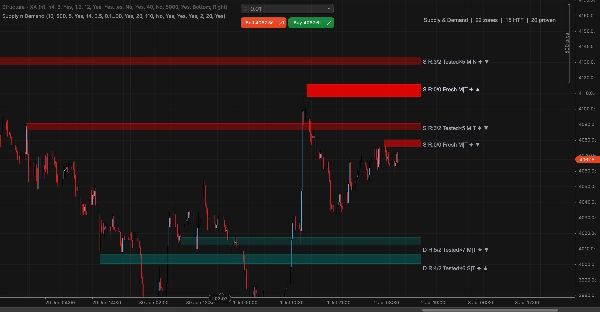
スイングピボットからの需給ゾーン検出。マルチタイムフレームの合流とボリュームフィルタリング付き。ゾーンは20バー先まで投影され、すべての再テストとブレイクアウトを追跡します。ゾーンの不透明度は時間経過とともに薄れ、MTF合流ゾーンにはしっかりとした境界線が付き、役割の反転により破られたゾーンは反対側に切り替わります。
各ゾーンには、すべての品質シグナルを含むコンパクトなラベルがあります:S/Dタイプ、再テスト/ブレイクアウト回数、新鮮度(Fresh/Tested×N)、爆発力(強/中/弱)、ベースの締まり具合(タイト/ノーマル/ワイド)、HTF合流(✦)、形成時のボリューム(▲/▼)。Fresh + ✦ + ▲ のゾーンは最高品質で、未触及、H4構造で確認され、高いボリュームで形成されています。
➤ 機能
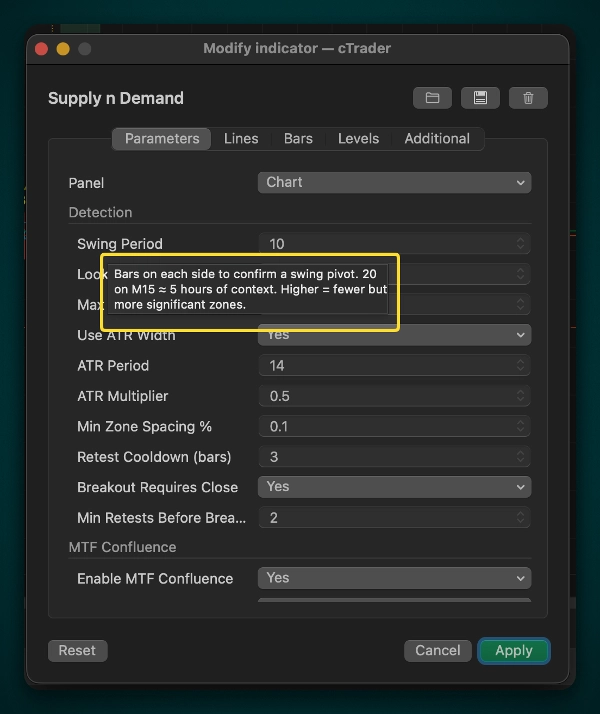
• 設定可能な期間でのスイングピボット検出(デフォルトはM15で20)
• H4 HTFハードゲート — H4構造と重なるゾーンのみ作成(オプション)
• マルチタッチ保護 — ブレイクアウトがカウントされる前にゾーンはN回の再テストを生き残る必要があります
• ボリュームフィルター — 平均以上のティックボリュームで形成されたゾーンに▲タグが付く
• ゾーンの反転 / 役割の反転 — 破られたサプライはデマンドに(その逆も同様)
• ビジュアルフェード — タッチ回数に応じて不透明度が減少。グローバルフェード%で透明度を制御
• トレンドライン境界線 — ゾーンの範囲にクリップされ、HTFゾーンはより強調される
• コンパクトダッシュボード — 右上にゾーン数、HTF数、実証済みゾーン数を表示
• 実証済みゾーンの保持 — 3回以上タッチされたゾーンは期限切れにならない
➤ パラメーターグループ
検出 — スイング期間、ATR乗数/サイズ、ブレイクアウトルール、再テストクールダウン
MTF合流 — H4参照、HTFハードゲート切替、HTFスイング/ルックバック
ボリューム合流 — ボリュームMA、閾値%、低ボリューム抑制
スタイル — 色、境界線の太さ、ラベルの表示
ビジュアル — グローバルフェード%、ダッシュボード切替
➤ トレーディングワークフロー
1. 高品質ゾーンを特定:Fresh、✦、▲、タイトベース
2. 価格がゾーンに到達するのを待つ — タッチだけでエントリーしないこと
3. ローソク足の確認を待つ(デマンドでは包み足、ピンバー、ハンマー;サプライではシューティングスター、包み足)
4. ストップロスはゾーン境界+バッファの外に設定;利益確定は次の反対ゾーンで
5. 反転の場合:ブレイクアウト後の再テストと確認ローソク足を待つ
➤ 推奨設定
• スキャルピング(M1-M5):スイング=8、ATR=1.0、HTF=H1、RequireHTF=false
• 日中取引(M15-M30):スイング=20、ATR=1.5、HTF=H4、RequireHTF=true(デフォルト)
• スイング(H1-D1):スイング=20、ATR=2.0、HTF=D1/W1、RequireHTF=true
➤ ラベルの読み方
各ゾーンには右端に圧縮された品質情報のラベルがあります。例: S R:3/2 Tested×5 M|N ✦ ▼
内訳
- S / D - サプライ(抵抗)またはデマンド(支持)
- R:3/2 - 再テスト:3 / ブレイクアウト:2 — ゾーンは3回保持され、2回破られた
- Tested×5 - 合計タッチ数(再テスト+ブレイクアウト=5)— 新鮮度指標
- M|N - 爆発力|ベース:M=中程度、N=標準ベース幅
- ✦ - HTF合流確認 — ゾーンは同タイプのH4ゾーンと重なっている
- ▼ / ▲ - 形成時のボリューム:▲=平均以上(強い)、▼=平均以下(弱い)
ゾーンを一目で読む方法
- Fresh + ✦ + ▲ — 最高品質:未触及、高タイムフレームで確認され、高ボリュームで形成
- Tested×5-7 — ゾーンは複数回利用されており、タッチごとに保持確率が低下
- 透明度が高い(フェードしている)ゾーンほど — 形成時のボリュームが低いか、タッチ回数が多い。ビジュアルアルファで「使い古された」ゾーンを即座に示す
このインジケーターは分析用です。取引は行いません。実際の取引を始める前に必ずデモ口座でテストしてください。
概要
Each zone features a compact label displaying key quality signals: zone type (Supply or Demand), retest and breakout counts, freshness, explosiveness, base tightness, higher timeframe confluence, and volume at formation. Zones formed on above-average tick volume and confirmed by H4 structure are marked as highest quality.
Key features include configurable swing pivot detection, optional H4 hard gate filtering, multi-touch protection requiring zones to survive multiple retests before breakout recognition, volume-based filtering, visual fading of zones with age or touches, and preservation of proven zones with three or more touches. A compact dashboard shows zone counts and quality metrics.
Parameters cover detection settings, multi-timeframe and volume confluence, visual style, and dashboard options. Recommended settings vary by trading style, from scalping to swing trading. The indicator provides visual support and resistance levels with detailed quality metrics for analysis but does not execute trades.
カスタマーレビュー
5 | 100 % | |
4 | 0 % | |
3 | 0 % | |
2 | 0 % | |
1 | 0 % |

ディスカッション
よくあるご質問




















価格