Описание
Какие рыночные данные он анализирует
London Open Signal загружает многолетнюю внутридневную историю прикреплённого символа напрямую с вашего брокера (разрешение M15 или H1, на ваш выбор) и реконструирует каждый прошедший торговый день в два окна: полный диапазон "дня" (настраиваемые часы начала/окончания) и саму лондонскую сессию (настраиваемые часы открытия/закрытия по времени сервера брокера). Для каждой исторической сессии он симулирует две гипотетические сделки — длинную и короткую — с фиксированным стопом и тейк-профитом, выходя на закрытии сессии, если ни одно из условий не достигнуто, с учётом спреда и издержек. Затем он проверяет пять простых идей на соответствие этим результатам, чтобы определить, какая из них, если вообще какая-либо, действительно предсказала исход: текущая ночная серия выигрышей/проигрышей, день недели, положение цены открытия сессии внутри диапазона предыдущего дня, гэп относительно закрытия предыдущего дня и была ли предыдущая дневная сессия необычно широкой или узкой.
Как интерпретировать сигналы и визуальные элементы
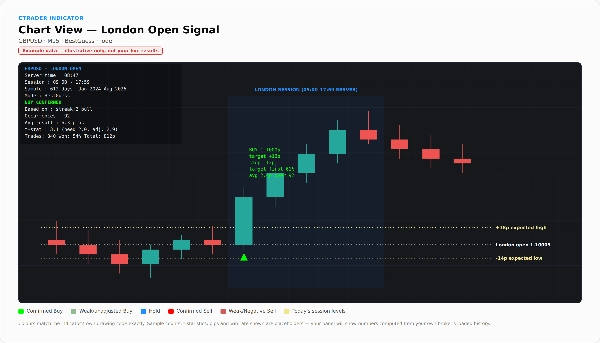
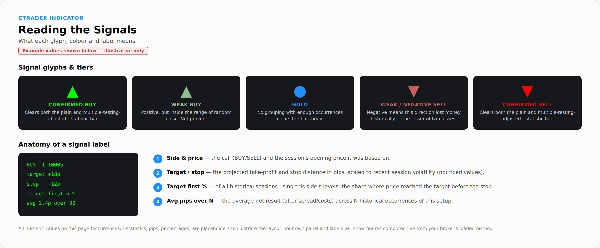
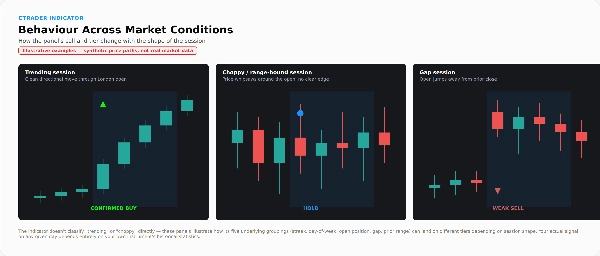
Зелёная стрелка вверх обозначает сигнал на покупку в момент открытия лондонской сессии в этот день; красная стрелка вниз — сигнал на продажу; синяя точка — удержание позиции (не найдено убедительного преимущества). Эти исторические стрелки вычисляются пошагово — каждая использует только данные, которые были доступны до этого дня, никогда не учитывая результат самого дня.
Панель на графике (вверху слева) показывает текущий сигнал и уровень: CONFIRMED, CONFIRMED (unadjusted), WEAK или NEGATIVE. Это указывает, насколько можно доверять стрелке — WEAK означает, что предполагаемое преимущество находится в пределах случайного шума, а NEGATIVE — что направление исторически приносило убытки, и стрелка отражает меньший из двух убытков. Панель также показывает, на какой группе основан сигнал, сколько раз он встречался, средний результат, t-статистику по обычному и скорректированному порогам множественного тестирования, и — что самое важное — текущий пошаговый счёт: сколько сделок инструмент бы совершил, процент выигрышей, общее количество пунктов, пункты на сделку и максимальную просадку. Если итоговый счёт равен нулю или отрицателен, панель сообщает об этом прямо.
Три дополнительных наложения добавляют детали: полная таблица результатов (каждая проверенная группа с размером выборки и t-статистикой для обоих направлений), "лаборатория стопа/тейка", показывающая, как меняется процент выигрышей в зависимости от расположения стопа и тейка — чтобы подчеркнуть, что высокий процент выигрышей не равен реальному преимуществу — и блок уровней сессии, показывающий типичный размер движения вверх, вниз и общий диапазон лондонской сессии на медиане/75-м/90-м процентилях. Пунктирные линии на сегодняшней сессии отмечают открытие и ожидаемые максимумы/минимумы с учётом волатильности.
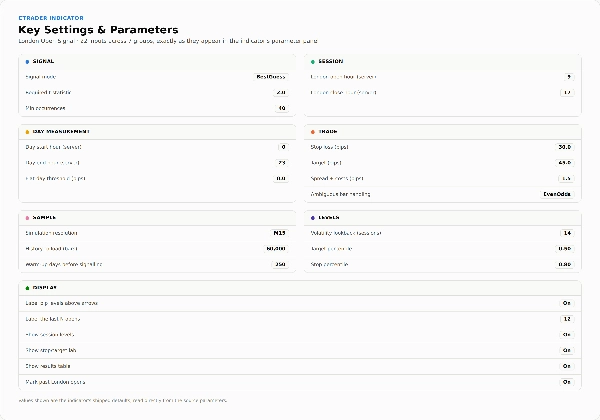
Ключевые настройки и параметры
- Сигнал: Режим (только подтверждённые против лучшей догадки), требуемая t-статистика, минимальное количество появлений для учёта группы
- Сессия: Час открытия Лондона, час закрытия Лондона (время сервера брокера)
- Измерение дня: Часы начала/окончания дня, порог плоского дня (пункты)
- Сделка: Стоп-лосс (пункты), Тейк-профит (пункты), учёт спреда/издержек (пункты), обработка неоднозначных баров (пессимистичный / равные шансы / оптимистичный, для баров, касающихся и стопа, и тейка)
- Выборка: Разрешение симуляции (H1/M15), загружаемая история (бары), дни прогрева перед началом сигналов
- Уровни: Период волатильности (сессии), целевой процентиль, стоп-процентиль
- Отображение: Метки стрелок / счётчик меток, показ уровней сессии, показ лаборатории стоп-цель, показ таблицы результатов, отметка прошлых открытий Лондона
Типичные случаи использования и торговые сценарии
Проверка панели перед открытием Лондона на текущий сигнал, его уровень и ожидаемый диапазон сессии на день. Исследование, сохраняется ли какая-либо простая, интерпретируемая закономерность статистически значимой для данной пары на её истории — и честная оценка, выживает ли эта закономерность после коррекции на множественное тестирование. Использование проекций уровней сессии (ожидаемые максимумы/минимумы) для планирования целей или стопов независимо от самого сигнала на покупку/продажу. Инструмент не предназначен для автоматического исполнения без участия — это индикатор, а не cBot, и он никогда не совершает сделки самостоятельно.
Для кого это лучше всего подходит
Трейдеры, которые хотят видеть реальную, проверенную пошагово историю сигналов, а не принимать утверждения на веру, и которые умеют читать t-статистику и число просадки вместе со стрелкой. Дискреционные трейдеры лондонской сессии, ценящие контекст диапазона сессии, даже если они решают игнорировать сигнал на покупку/продажу. Инструмент сознательно не создан для тех, кто ищет систему "просто следуй за стрелкой" — он оценивает собственные сигналы и прямо сообщает, когда цифры не поддерживают торговлю по ним.
Важные ограничения и примечания по использованию
- Производительность рассчитывается в реальном времени на основе той истории брокера, которая загружена при запуске индикатора — это не фиксированный, заранее сгенерированный файл бэктеста, поэтому результаты могут отличаться в зависимости от брокера/счёта и требуют достаточного объёма загруженной истории (увеличьте "Историю для загрузки", если панель сообщает о недостатке данных).
- Коррекция на множественное тестирование — эвристика, а не гарантия — скорректированный порог снижает, но не устраняет вероятность того, что результат кажется значимым случайно.
- Пять проверяемых идей — простые однофакторные классификаторы, проверяемые независимо, а не в комбинации — сознательный выбор для сохранения интерпретируемости инструмента и избежания дополнительного риска переобучения.
- В режиме Best Guess индикатор всегда показывает направление, включая сигналы уровня NEGATIVE — всегда читайте метку уровня, а не только стрелку.
- Симулированные заполнения стопа/тейка используют упрощённое предположение для баров, касающихся обоих уровней в одной свече; реальное исполнение может отличаться.
- Основан исключительно на цене и статистике — без новостей, фундаментального анализа или кросс-активов.
- Только визуальный и аналитический инструмент; сделки не исполняет.
Сводка
The indicator tests five simple, independent factors—overnight streak, day of the week, opening price position within the previous day’s range, gap size, and previous day’s range width—to identify statistically significant edges. Signals are displayed as arrows on the chart: green for Buy, red for Sell, and blue for Hold, with a tier label (CONFIRMED, WEAK, NEGATIVE) indicating the confidence level based on walk-forward testing.
A panel shows detailed statistics including win rate, total pips, t-statistics, and drawdown, updated live from broker data. Optional overlays provide a full results table, stop/target sensitivity analysis, and session-level range projections. The tool is purely analytical and visual; it does not execute trades and is intended for traders comfortable interpreting statistical metrics alongside signals.