
Description
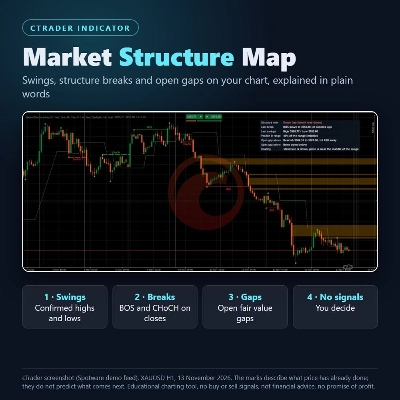
Market Structure Map draws the structure of your chart and explains it in a small panel. It does not place trades and it gives no buy or sell signals.
WHAT IT SHOWS
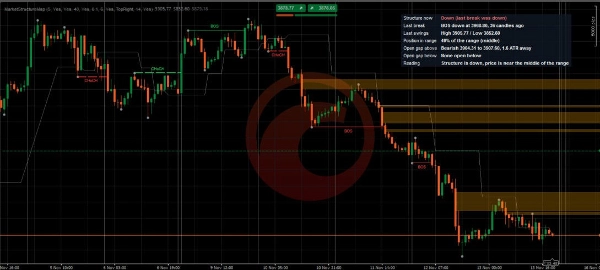
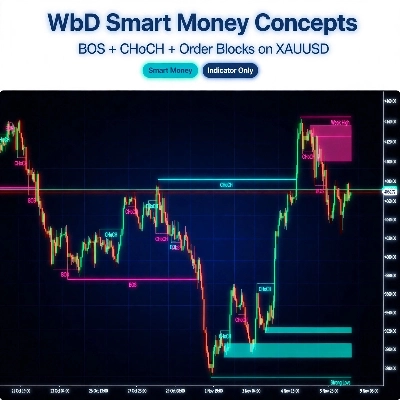
- Confirmed swing highs and lows (marked after 5 more candles, then they never move).
- BOS lines: a candle closed beyond the last swing in the direction of the current structure. CHoCH lines (dashed): the first close beyond the last swing against it. Decided on closed candles only; a wick is not a break.
- Open fair value gaps as boxes; a box disappears once price trades through its far edge.
- A 50% line of the current swing range (premium above it, discount below, in plain words).
- A panel: structure now, last break, last swings, position in the range, nearest open gap above and below with its distance in ATR, and a one-line reading.
SETTINGS
Swing length, show swings / breaks / gaps, how many recent breaks to draw, smallest gap (x ATR), most open gaps, ATR length, panel position, popup alerts.
LIMITS
- Checked in cTrader 5.10.22 (Spotware demo) on the XAUUSD and EURUSD 1-hour charts. Other brokers, symbols and timeframes were not tested. Popup alerts were not tested live.
- Marks describe what price has already done. They do not predict what comes next, and a break or a gap can fail.
- Educational charting tool. Not financial advice, not a signals service, no promise of profit. Trading is risky and you can lose money.
SETUP
Add it to a chart; it draws on the price chart. Change the swing length in the settings to get more or fewer swings.
Summary
It also displays open fair value gaps as boxes that disappear once price trades through their far edge, and plots a 50% line of the current swing range, labeling price as "premium" above or "discount" below this midpoint. A dedicated panel summarizes the current market structure, recent breaks, swing positions, nearest open gaps with their distance measured in Average True Range (ATR), and provides a concise one-line reading.
Settings allow customization of swing length, visibility of swings, breaks, and gaps, number of recent breaks shown, gap size thresholds (in ATR), ATR length, panel position, and popup alerts. The indicator has been tested on cTrader with XAUUSD and EURUSD 1-hour charts. It serves as an educational tool to describe past price action and market structure without offering financial advice or trading signals.
Discussion
Customer reviews
FAQ
More from this author





Price
