Beschreibung
SMC Guardian Visual Pro
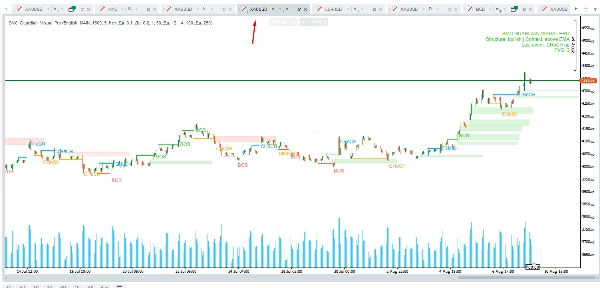
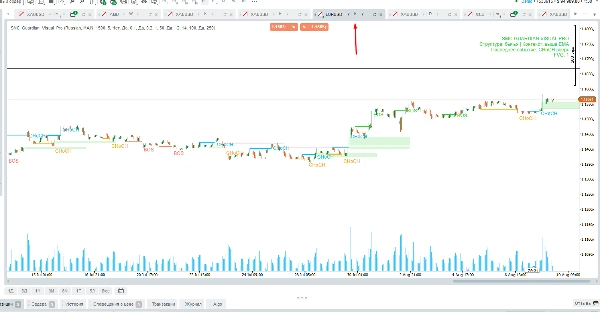
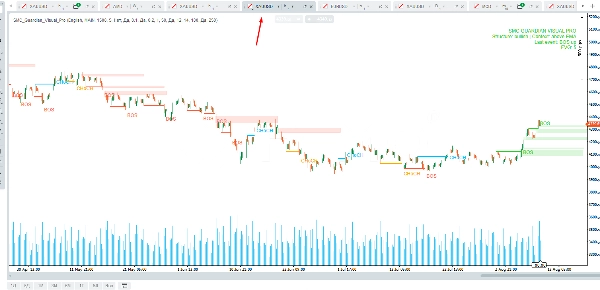
SMC Guardian Visual Pro ist ein kostenloser Chart-Overlay-Indikator für die bestätigte Marktstrukturanalyse. Er erkennt schwingungsbasierte Break of Structure (BOS) und Change of Character (CHoCH) Ereignisse von geschlossenen Bars, hebt ATR-gefilterte Fair Value Gap Zonen hervor und zeigt den aktuellen EMA-Marktkontext an.
Hauptmerkmale:
- Bestätigte bullische und bärische BOS-Ereignisse
- Bestätigte bullische und bärische CHoCH-Ereignisse
- ATR-gefilterte Fair Value Gap Zonen
- Automatische Handhabung von gefüllten und abgelaufenen FVG-Zonen
- Optionale bestätigte Swing-Labels
- EMA-Kontext und aktueller Strukturstatus
- Englische und russische Benutzeroberfläche
- Separate Zeichen-IDs für mehrere Chart-Instanzen
- Zeichen- und Verlaufsgrenzen für stabile Leistung
- Keine externen Zugriffsberechtigungen
Vorgeschlagene Verwendung:
- Instrumente: beliebte Forex-Paare, Metalle und liquide Indizes
- Bevorzugte Chart-Perioden: M15 bis H4
- Anwendungsfall: diskretionäre Marktstrukturanalyse neben den eigenen Einstiegregeln und dem Risikoplan des Traders
Bestätigungsverhalten:
Swing-Punkte benötigen die konfigurierte Anzahl von Bars auf beiden Seiten, bevor sie bestätigt werden. Ein bestätigtes historisches Swing-Label wird erst nach dieser Bestätigungsverzögerung auf seinem ursprünglichen Pivot-Bar platziert. Strukturelle Ereignisse werden auf geschlossenen Bars unter Verwendung bestätigter Swing-Level ausgewertet.
Dieser Indikator öffnet, ändert oder schließt keine Trades. Er stellt keine Finanzberatung dar und garantiert keine zukünftigen Ergebnisse.
Zusammenfassung
Kundenbewertungen
5 | 100 % | |
4 | 0 % | |
3 | 0 % | |
2 | 0 % | |
1 | 0 % |