Beschreibung
🚀 Verwandeln Sie Ihr Chart in ein strategisches Entscheidungszentrum
Smart Tech Analysis ist nicht nur ein Indikator.
Es ist ein vollständiges intelligentes Analyse-Dashboard, entwickelt für Trader, die Klarheit, Präzision und Agilität bei Entscheidungen wünschen.
Während die meisten Indikatoren nur isolierte Informationen liefern, integriert Smart Tech Analysis:
✔ Trend
✔ Volumen
✔ Fibonacci
✔ Unterstützung und Widerstand
✔ Technische Signale
✔ Operative Empfehlungen
✔ Detaillierte Preisinformationen
Alles in einem einzigen dynamischen und interaktiven Dashboard.
🔥 DER GROßE UNTERSCHIED
🎯 1. 6-in-1 System – Integrierte Analyse
Sie müssen nicht mehr zwischen mehreren Indikatoren wechseln.
Smart Tech Analysis kombiniert:
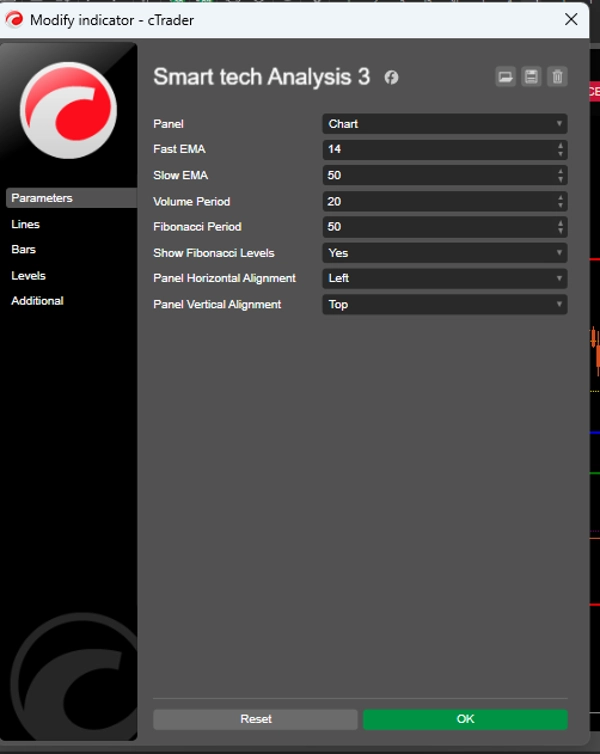
📈 Schnelle und langsame EMAs (14 und 50)
📊 Volumen mit Vergleichsanalyse
🧩 Automatisches Fibonacci
🛡 Dynamische Unterstützung und Widerstand
🚦 Intelligente Signalgenerierung
📌 Empfehlungen mit berechnetem Stop und Ziel
👉 Dies reduziert visuelles Rauschen und erhöht die Objektivität.
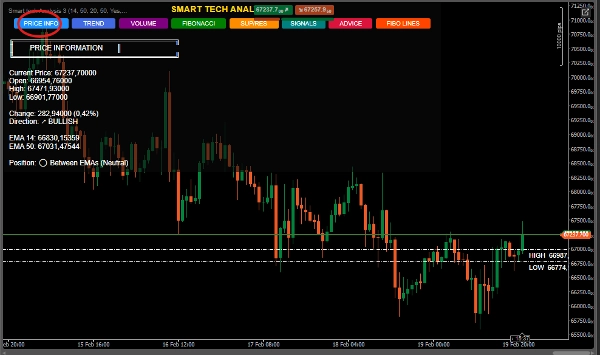
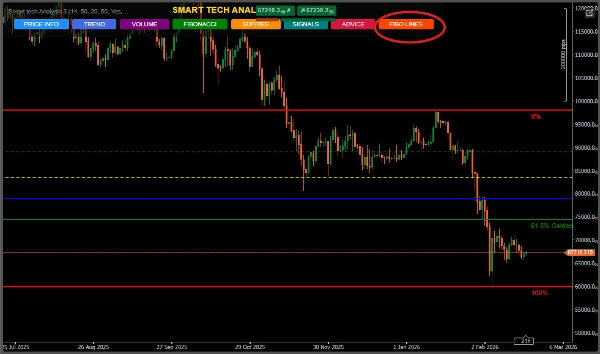
🧠 2. Exklusives interaktives Panel
Professionelle Oberfläche mit intelligenten Schaltflächen:
PREISINFO
TREND
VOLUMEN
FIBONACCI
UNTERSTÜTZUNG/WIDERSTAND
SIGNALE
EMPFEHLUNGEN
Der Trader wählt genau aus, was er sehen möchte.
📌 Organisation.
📌 Kontrolle.
📌 Professionalität.
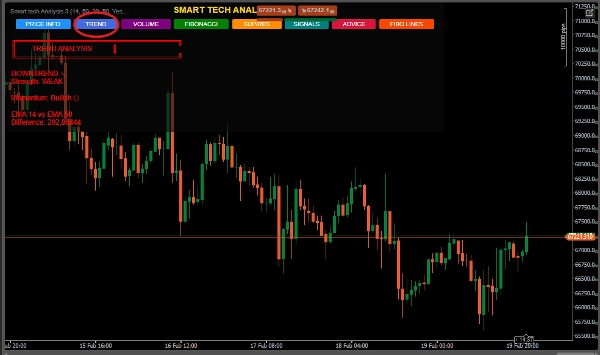
📈 3. Trendanalyse mit Stärke und Momentum
Es zeigt nicht nur, ob es nach oben oder unten geht.
Es berechnet:
Trendintensität
Prozentuale Stärke zwischen EMAs
Klassifikation: Schwach, Moderat oder Stark
Dies vermeidet schwache Einstiege in Seitwärtsmärkten.
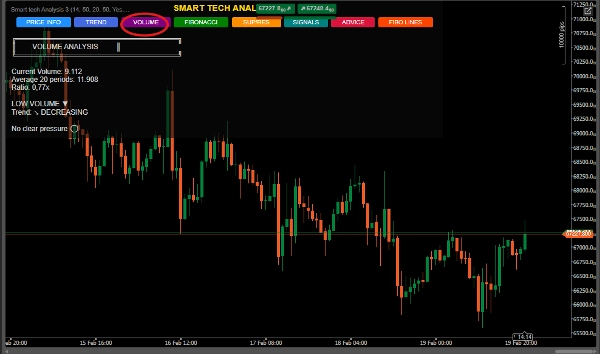
📊 4. Volumen mit institutioneller Lesart
Das System erkennt:
Extremes Volumen
Kauf- oder Verkaufsdruck
Beschleunigung oder Verzögerung
Vergleich mit historischem Durchschnitt
👉 Ideal zur Erkennung möglicher institutioneller Aktivitäten.
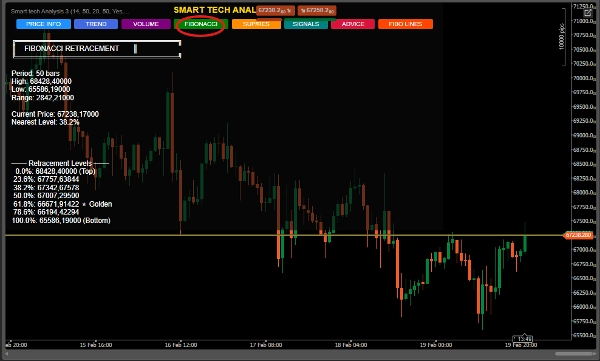
🧩 5. Automatisches Fibonacci mit Goldener Zone
Dynamisch über den definierten Zeitraum berechnet.
Besondere Hervorhebung für:
⭐ 61,8% Zone (Goldene Zone)
📌 Identifikation des nächsten Levels
📌 Bullishe und bearishe Extensions
📌 Automatische kontextbezogene Empfehlung
Perfekt für Retracement-Trader und Swing-Trader.
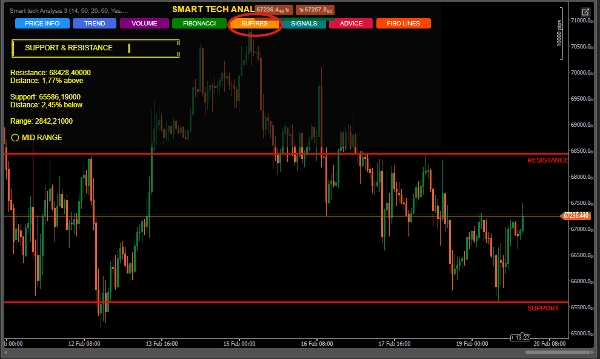
🛡 6. Intelligente Unterstützung & Widerstand
Erkennt relevante Hoch- und Tiefpunkte
Zeigt prozentualen Abstand zum aktuellen Preis
Klassifiziert Position: Nahe Unterstützung, Widerstand oder Mittelbereich
Zeichnet automatische Linien im Chart
Ideal für den Einstieg in strategische Zonen.
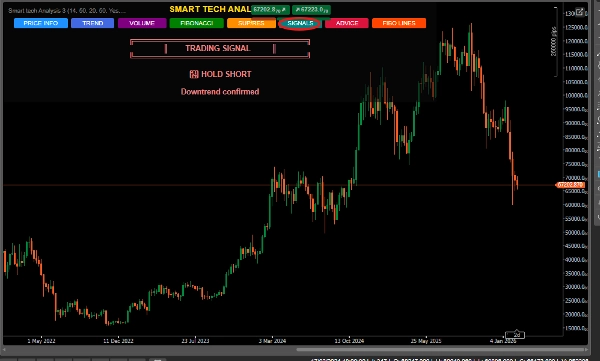
🚦 7. Konfluenz-Signalsystem
Der Algorithmus generiert keine zufälligen Signale.
Er kombiniert:
✔ EMA-Crossover
✔ Nähe zu Unterstützung/Widerstand
✔ Trendstruktur
✔ Preiskontext
Klassifikation:
🟢 STARKER KAUF
🔴 STARKER VERKAUF
📈 HALTEN LONG
📉 HALTEN SHORT
⏸ WARTEN
Mit angegebenem Vertrauensniveau.
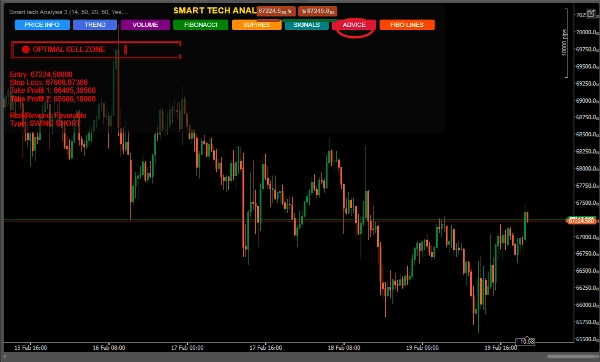
🎯 8. Empfehlungen mit Risikomanagement
Das "EMPFEHLUNGEN"-Panel liefert:
Vorgeschlagenen Einstieg
Technischen Stop Loss
Zwei Take-Profit-Ziele
Swing-Struktur (Long oder Short)
Operationskontext
👉 Es ist nicht nur Analyse.
👉 Es ist ein strukturierter Plan.
🏆 Für wen ist dieser Indikator geeignet?
✔ Anfänger-Trader, die Klarheit benötigen
✔ Fortgeschrittene Trader, die Konfluenz wünschen
✔ Erfahrene Trader, die Effizienz suchen
✔ Swing-Trader
✔ Scalper, die strukturelle Bestätigung verwenden
💎 Warum hebt es sich auf dem Markt ab? Übliche Indikatoren Smart Tech Analysis
Isolierte Informationen Integrierte Analyse Visuelle Verschmutzung Organisiertes Dashboard Kein Kontext Technische Konfluenz Kein Management Vorgeschlagener Stop und Ziel Einfache Signale Signale mit Bestätigung
📊 Direkte Vorteile
✔ Reduziert emotionale Entscheidungen
✔ Erhöht die Genauigkeit
✔ Verbessert das strukturelle Lesen
✔ Spart Zeit
✔ Hebt den professionellen Standard des Traders
🧠 Marktpositionierung
Smart Tech Analysis ist ideal für:
Forex-Markt
Indizes
Rohstoffe
Kryptowährungen


