📊 VPOC MONTE CARLO ERWARTETER WERT
https://chartshots.spotware.com/c/69c558e2c68df
Integrierte Marktanalyse: Volumenprofil + Statistische Projektion 🎯
🎯 WAS IST DAS?
VPOC Monte Carlo Erwarteter Wert ist ein quantitativer Analyseindikator, der zwei professionelle Handelsmethoden kombiniert:
- Markttiefenprofil (VPOC) - Identifiziert, wo das Volumen wirklich konzentriert ist 🏦
- Monte Carlo Simulation - Projektiert zukünftige Szenarien basierend auf statistischen Wahrscheinlichkeiten 📈
Das Ergebnis ist ein Analysesystem, das Ihnen sagt, wo das Geld ist (Point of Control) und wohin es wahrscheinlich geht (projizierter Erwarteter Wert) 🧠
⚙️ WIE FUNKTIONIERT ES?
Modul 1: Tiefenprofil (VPOC) 📊
Der Indikator analysiert die letzten 200 Balken (konfigurierbar) und verteilt das Volumen auf 30 Preisniveaus. Er berechnet:
- Point of Control (PoC): Der Preis mit dem höchsten gehandelten Volumen - repräsentiert den Marktkonsens, wo Käufer und Verkäufer am aktivsten waren ⚖️
- Delta: Unterschied zwischen Kauf- und Verkaufsdruck auf jeder Ebene 🔄
- Heatmap: Visualisierung der Aktivitätskonzentration 🔥
Die Logik: Der Preis neigt dazu, zum PoC zurückzukehren, weil dort die meiste ausstehende Liquidität liegt. Wenn der Preis weit vom PoC entfernt ist, besteht eine höhere Wahrscheinlichkeit der Rückkehr 🔄
Modul 2: Statistische Projektion (Monte Carlo) 🎲
Verwendet stochastische Simulationen (standardmäßig 1.000 Iterationen), um den zukünftigen Preis zu projizieren:
- Berechnet den historischen Trend und die annualisierte Volatilität des Assets 📉📈
- Erzeugt zufällige Pfade unter Verwendung einer Normalverteilung (geometrisches Brown’sches Bewegungsmodell) 🌊
- Schätzt den Erwarteten Wert mit Standardabweichungsbändern (±1 Sigma) 📏
Angewandte Formel: - Drift pro Balken = Annualisierte Rendite / Handelstage 🧮
- Volatilität pro Balken = Annualisierte Volatilität / √Tage ⚡
- Projektion = Aktueller Preis × e^(Gesamtdrift + normaler Zufallswert × Gesamtvolatilität) 🔢
Modul 3: Synergie 🔗
Kombiniert beide Analysen, um kontextbezogene Signale zu erzeugen:
Tabelle
Signal Bedingung Bedeutung
BULLISH ↑ 🟢 Preis > PoC + Positive Projektion Bullenmarkt bestätigt durch Volumen
BEARISH ↓ 🔴 Preis < PoC + Negative Projektion Bärenmarkt bestätigt durch Volumen
CHANCE ★ 💡 Preis < PoC + Positive Projektion Möglicher Bounce von Volumenunterstützung
DIVERGENZ ⚠️ ⚠️ Preis > PoC + Negative Projektion Warnung vor möglicher Umkehr
📈 WOFÜR WIRD ES VERWENDET?
✅ Identifikation wichtiger Volumenebenen - Der PoC wirkt als Preismagnet 🧲
✅ Schätzung der Erfolgschancen - Prozentsatz der Gewinnszenarien in der Simulation 🏆
✅ Bewertung von Risiko/Rendite - Projektiertes Sharpe-Verhältnis und Standardabweichung 📊
✅ Bestätigung der Handelsrichtung - Synergie zwischen Position relativ zum PoC und statistischem Momentum 🎯
✅ Zielprojektion - Erwartete Preisniveaus für den definierten Haltezeitraum 🎯
🎮 KONFIGURATION UND ANWENDUNG
Hauptparameter:
Tabelle
Gruppe Parameter Standard Beschreibung
Tiefenprofil Analysezeitraum 200 Balken Historie zur Berechnung des Volumenprofils
Preisniveaus 30 Profilauflösung (mehr Niveaus = mehr Details) 🔍
Horizontaler Versatz 5 Profilposition im Chart 📏
Statistische Projektion Maximale Betriebsdauer 252 Balken Zeithorizont der Projektion ⏱️
Investiertes Kapital $1.000 Basis für monetäre Berechnungen 💰
Simulationen 1.000 Anzahl der Zufallspfade (mehr = genauer, langsamer) 🔄
Risikofreier Satz 5% Für Sharpe-Verhältnis Berechnung 📉
Historische Strategie TP/SL verwenden Nein Aktivieren, um mit festen Zielen zu simulieren 🎯
Wie man die Ergebnistabelle interpretiert:
einfach
Kopieren
ERWARTETE WERTSTATISTIKEN
┌──────────────┬─────────┬─────────┬─────────┬────────┐
│ Methode │ $ Betrag│ % Rendite│ Gewinnrate│ Sharpe │
├──────────────┼─────────┼─────────┼─────────┼────────┤
│ Historisch │ -$19,56 │ -1,96% │ 47,2% │ -1,24 │
│ Simulation │ -$54,05 │ -5,40% │ 21,4% │ -4,95 │
└──────────────┴─────────┴─────────┴─────────┴────────┘
- Historisch: Durchschnittliche Performance ähnlicher vergangener Trades 📜
- Simulation: Durchschnittliches Ergebnis der 1.000 Monte Carlo Simulationen 🎲
- Gewinnrate: Prozentsatz der Szenarien mit positivem Ergebnis ✅
- Sharpe: Risiko-adjustierte Rendite (größer als 1 ist gut, negativ ist schlecht) 📈
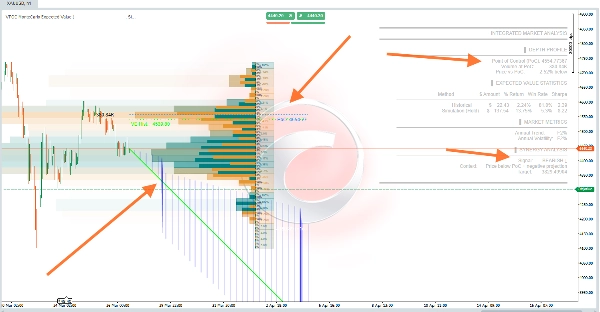
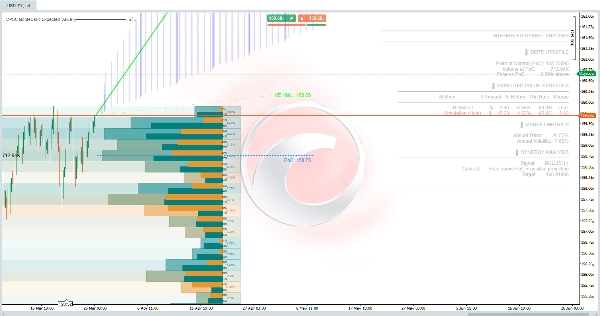
🖼️ Visuelle Elemente im Chart
Tabelle
Element Farbe Bedeutung
Volumenprofil Orange/blauer Verlauf Aktivitätskonzentration nach Preisniveau 🎨
PoC-Linie Blau gepunktet Point of Control in die Zukunft projiziert 🔵
EV-Projektionslinie Grün/Magenta Erwartete Preisentwicklung 🟢🔴
±1σ-Band Weiße gepunktete Linien 68% Konfidenzbereich 📊
Historische EV-Linie Grün gepunktet Erwarteter Wert basierend auf historischen Daten 🟢
Projektionszone Translucenter blauer Bereich Wahrscheinlichkeitsbereich zwischen den Bändern 🔵
⚠️ WICHTIG - Einschränkungen
- Kein Kauf-/Verkaufssignal - Es ist ein probabilistisches Analysewerkzeug 🛠️
- Monte Carlo Simulationen gehen davon aus, dass die historische Verteilung gilt (sagt keine Black-Swan-Ereignisse voraus) 🦢❌
- Der PoC ist dynamisch - Wird bei jedem neuen Balken neu berechnet 🔄
- Benötigt ausreichende Historie - Mindestens 252 Balken für zuverlässige Projektionen 📊
- Kryptowährungen - Der Indikator passt sich automatisch auf 365 Handelstage jährlich an vs. 252 für traditionelle Märkte 🪙
💡 Empfohlene Anwendungsstrategie
- Suche nach CHANCE ★ 💡 - Preis unter PoC aber mit positiver Projektion (mögliche Unterbewertung)
- Bestätige mit Gewinnrate > 50% - Höhere statistische Erfolgschance ✅
- Vermeide DIVERGENZ ⚠️ ⚠️ - Überbewerteter Preis im Verhältnis zum tatsächlichen Volumen
- Nutze PoC als Referenz - Stops oder Ziele um dieses Liquiditätsniveau herum 🎯
- Vergleiche Historisch vs Simulation - Wenn sie stark abweichen, ändert sich das Marktregime 🔄