present
Registrati e ricevi uno sconto da $50 sul tuo primo acquisto
Trading product for IR Moving Cloud Indicatore, image 1
IR Moving Cloud
5.61K
Installazioni gratuite

Descrizione

Riepilogo

Profilo indicatore

Discussioni

Recensioni dei clienti

0.0
Recensioni: 0
Recensioni dei clienti
Questo prodotto non ha ancora ricevuto recensioni. L'hai già provato? Fallo sapere agli altri per primo!

Domande frequenti

I prodotti disponibili tramite cTrader Store, inclusi bot di trading, indicatori e plugin, sono forniti da sviluppatori terzi e resi disponibili esclusivamente a scopo informativo e di accesso tecnico. cTrader Store non è un broker e non fornisce consulenze in materia di investimento, raccomandazioni individualizzate o garanzie di risultati futuri.

Altro da questo autore

with this indicator you could see other time frame candle in your chart.
show spread on chart
some user add moving average to macd to see better. in ctrader 4.3.11 there is a problem with this . I make a macd tha
this indicator show macd on chart.
Multi Time Frame Moving Average is a powerful and flexible indicator for cTrader
 this moving include everything that a trader needs from Moving Average.
this indicaotr show distance between Tenkan to Kijun, Close to Kijun and Close to Tenkan 
Add Slowing to IR Moving Average.
IR Candle Open plots customizable opening price lines for daily, weekly, and monthly candles
Coral indicator
you could put your check list in your chart you could split your test with “,” you could put your checklist in indicat
this indicator show other time frame close in lower time frame. for ex: show daily close in m 15.

Potrebbe interessarti anche

Visual Trend Momentum is a MA/ATR/Volume trend tool. Visual signals for strong trends & reversals. Customizable. 📈📉
⚔️Limited version. Draws clean session box (Tokyo / London / New York / Overlap) and optional breakout plan (EP/TP/SL)⚔️
Multi VWAP. Three timeframes. One clean chart. Your Essential Trading Tool.
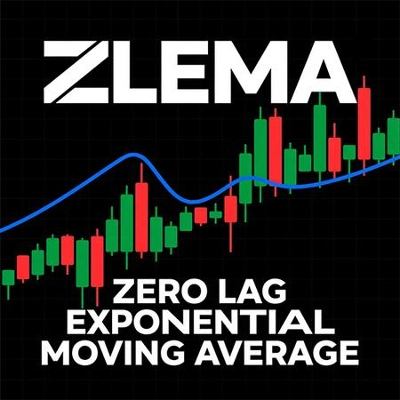
ZLEMA (Zero Lag EMA) is a faster, smoother version of EMA, ideal for capturing quick market shifts and trends.
Protect your funded account. Real-time Daily Equity Drawdown monitor with Green / Orange / Red flashing alerts.
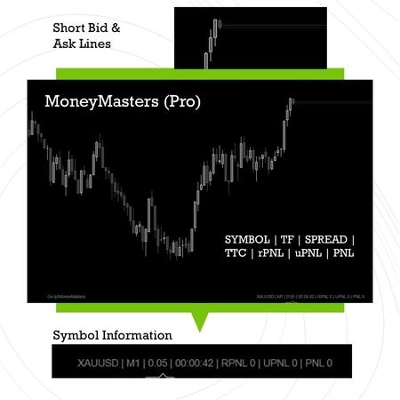
NEW - PNLs as % - daily, weekly, monthly, or yearly & Spread, Time To Close, PNL Alerts, custom Bid / Ask lines
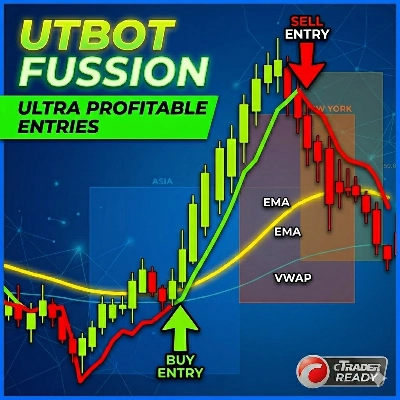
The UTBot you know from TradingView — now on cTrader with confirmed signals, VWAP, EMA and session overlays.
Dense EMA rainbow + Pro tools & a tested engine — get more from your EMAs, your research base for EMA bots.
RSI on the main chart with 45/55 momentum levels, overbought/oversold levels, averaged RSI, and multi-timeframe support.
Displays real-time balance, equity, P&L, margin metrics directly on your charts.
Multi-asset screener with real-time RSI/volatility analysis, interactive dashboard, and color-coded trading signals.
Strong Supertrend Turn Market Movement into a Clear Map Market analysis
Fractal Arrow Buy and Sell Indicator
COT Flows. Clear Direction. 🧭
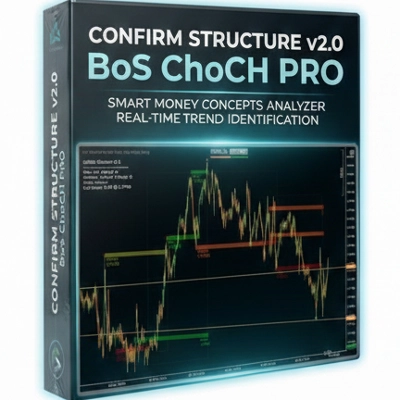
BoS ChoCH Pro,Strict Mode,False Breakout Filter,Average hit rate: 72-78%
RSI, MACD, Stochastic, CCI & Momentum divergence scanner with confluence scoring. Never miss a signal again!
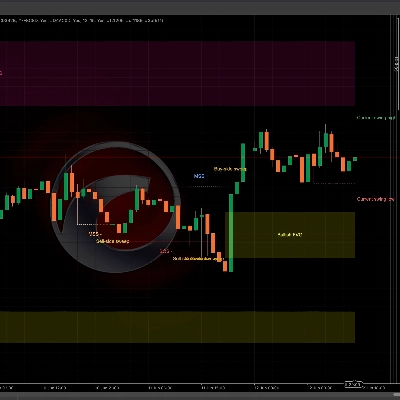
WinSMC is an overlay SMC indicator for cTrader. It helps you visually identify!
Advanced market structure and institutional cycle mapper with visual reference cards and entry alerts

Prezzo

5.61K
Installazioni gratuite