present
Sign up and get $50 off your first purchase
Trading product for Clean Trade Optimization Line Pro Indicator Supertrend, image 2
Trading product for Clean Trade Optimization Line Pro Indicator Supertrend, image 3
Trading product for Clean Trade Optimization Line Pro Indicator Supertrend, image 4
Trading product for Clean Trade Optimization Line Pro Indicator Supertrend, image 5
Since 23/07/2026

Description

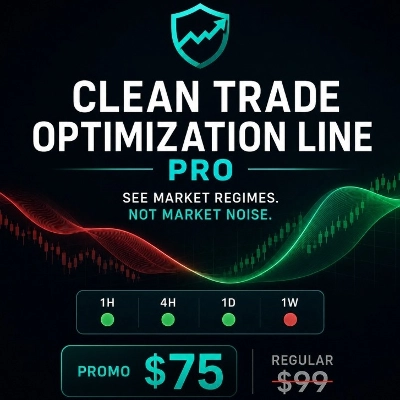
See market regimes. Not market noise.


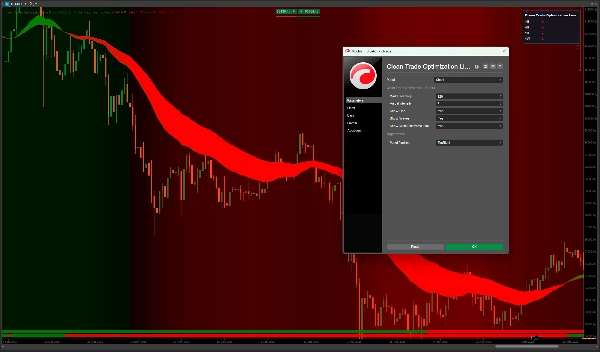
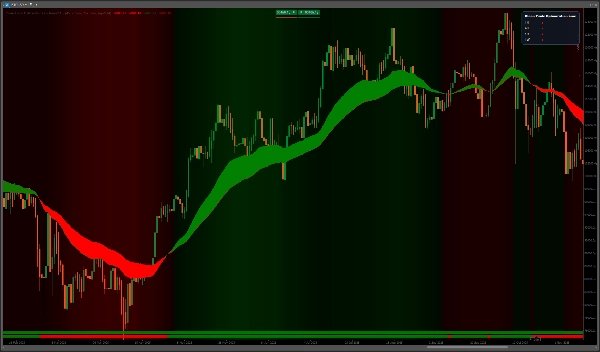
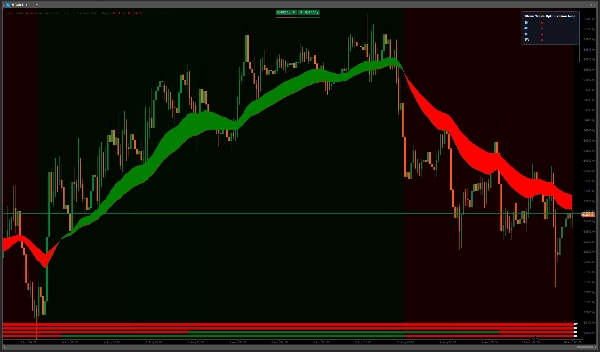
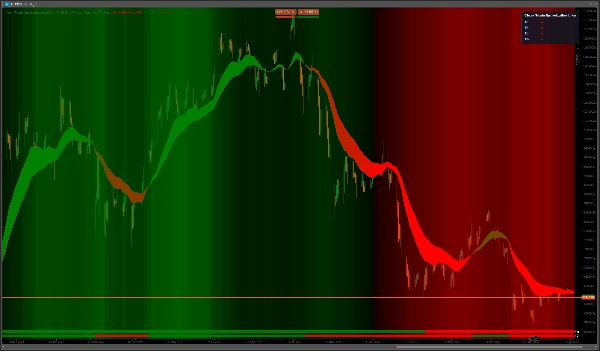
Clean Trade Optimization Line Pro transforms complex price action into a clean, premium visual experience built for focus.


The directional ribbon makes changing market character immediately visible. Smooth background waves add broader context without clutter, while the multi-timeframe view keeps the bigger picture close at hand. Historical status bars align directly with the chart, helping you see how market context evolved alongside price.


The interface stays intentionally simple. Add Clean Trade Optimization Line Pro to a chart, choose the visual intensity you prefer, and focus on what matters.


Clean Trade Optimization Line Pro works beautifully with BTC on the 1D timeframe, where major market transitions can be viewed with exceptional clarity.


Highlights


• Premium ribbon visualization

• Smooth bullish and bearish market context

• Multi-timeframe status overview

• Chart-aligned historical context

• Clean, focused interface

• Non-repainting historical presentation

• Designed exclusively as a cTrader indicator


Less noise. More context. Better focus.


Clean Trade Optimization Line Pro is a technical analysis indicator only. It does not predict future market performance and does not guarantee profits or trading success.


Trade carefully. Manage your risk.

Summary

AI summary
Clean Trade Optimization Line Pro is a technical analysis indicator designed exclusively for the cTrader platform. It provides a premium visual representation of market regimes, focusing on clarity by filtering out market noise. The indicator features a directional ribbon that highlights changes in market character, smooth background waves to convey bullish and bearish context, and a multi-timeframe status overview to maintain awareness of broader market conditions. Historical status bars aligned with the price chart allow users to track how market context has evolved over time. Its interface is intentionally simple, enabling users to adjust visual intensity and focus on relevant market information. The indicator is optimized for use with Bitcoin (BTC) on the daily (1D) timeframe, where it helps identify major market transitions with enhanced clarity. It offers non-repainting historical data presentation to support reliable analysis. Key features include premium ribbon visualization, smooth market context waves, multi-timeframe overview, chart-aligned historical context, and a clean, focused interface. This product is categorized under trend indicators and supports visualization and signal outputs, including cross signals, based on bar data inputs.
Indicator profile
Indicator category
Trend
Output type
Signals
Visualisation
Data requirements
Bars only
Supported signals
Cross

Discussion

Customer reviews

0.0
Reviews: 0
Customer reviews
No reviews for this product yet. Already tried it? Be the first to tell others!

FAQ

Supertrend
Products available through cTrader Store, including trading bots, indicators and plugins, are provided by third-party developers and made available for informational and technical access purposes only. cTrader Store is not a broker and does not provide investment advice, personal recommendations or any guarantee of future performance.

You may also like

Indicator
VWAP
Support & Resistance
Trading.FC$_vwap Algo shows VWAP trends, dynamic support/resistance and deviation bands to spot potential trade entries.
Indicator
ATR
RSI
+8
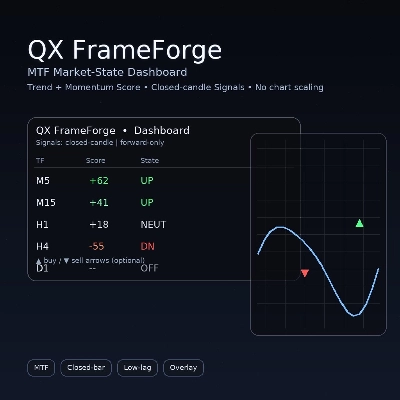
Multi-timeframe market-state dashboard: Score (-100..+100) + UP/NEUT/DN per TF, with optional closed-candle arrows.
Indicator
AI
SMC
+11
Perfect Entry Price designed to help traders identify the most accurate and reliable price levels for market entries
Indicator
SMC
Prop
+13
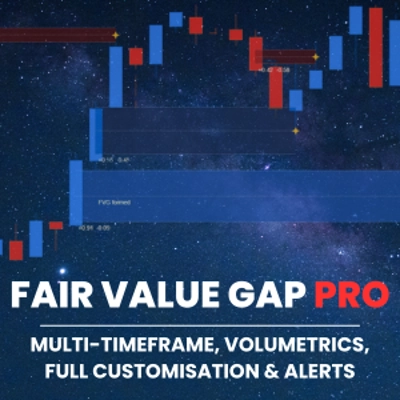
Institutional FVG detection with HTF projection, precise volume deltas, and smart fill logic.
Indicator
Volume
Key Levels
+4
Session & Kill Zone Highlighter - Visual tool for London, NY, Tokyo, Sydney sessions plus ICT Kill Zones.
Indicator
Risk Dashboard
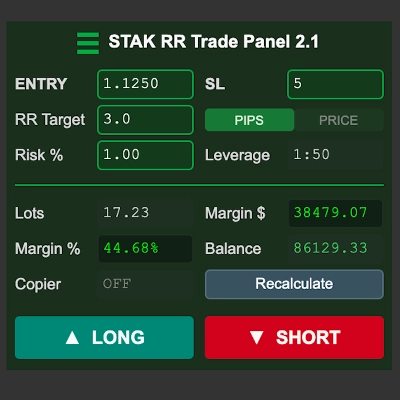
Risk-based lot sizing, exact stop placement and hard margin limits. Nothing is sent until you confirm.
Indicator
AI
ATR
+20
Buy and Sell Signals
Indicator
ATR
Scalping
+1
Auto Fibonacci Retracement Pro – Smart Swing & Golden Zone Levels
Indicator
RSI
VegaXLR's cTrader StochRSI identifies overbought/oversold RSI levels for precise trade entries.
Indicator
XAUUSD
Professional Volume Profile Indicator - Shows volume distribution, POC, Value Areas & Buy/Sell pressure.
Indicator
Volume
Order Block
+4
Volume Profile with fixed period, custom range and buy/sell pressure.
Indicator
Visually master the Inside Bar strategy with clear breakout signals and professional chart highlighting 📈🔔📉
Indicator
ATR
Prop
+7
Smart momentum tool uses advanced filtering and colour cues for clearer market direction and trading signals.
Indicator
BOS
EMA
+5
VWAP Bands indicator with 3 standard deviation levels, buy/sell zones, and a draggable ON/OFF button to toggle the entir
Indicator
Forex
Signal
+4
Gann Pivot Vision is an innovative analytical tool that combines classic pivot reversal levels and Gann geometry
Indicator
Inside Bar
Save time by lighting a candle to look within yourself in another temporality
Indicator
Key Levels
Liquidity Grab
+1
Visualize Asia, London and New York sessions with range boxes, opening levels, prior-day highs/lows and sweep markers.
Indicator
Imbalance
Key Levels
+1
Keep open imbalance zones, untouched session highs and lows and the day's ADR range in view, without scrolling back.

Price

Since 23/07/2026