
Descrizione
## 📊 Che cos'è Support & Resistance Breaks?
Support & Resistance Breaks è un indicatore di rilevamento a livello professionale che identifica i livelli chiave di prezzo in tempo reale e avvisa i trader sulle opportunità di breakout ad alta probabilità. A differenza degli indicatori tradizionali che hanno un ritardo, questo strumento rileva le zone di supporto e resistenza mentre si formano, permettendo ai trader di reagire rapidamente ai movimenti di mercato.
L'indicatore combina l'analisi dei pivot point con la conferma del volume e un sofisticato sistema di punteggio per evidenziare solo i livelli più significativi.
## 🎯 Caratteristiche principali
### 1. Rilevamento dei livelli in tempo reale
- **Nessun ritardo** : I livelli vengono rilevati mentre si formano, non a posteriori
- **Aggiornamenti dinamici** : Supporto e resistenza si adattano alle condizioni di mercato in evoluzione
- **Regolazione automatica** : I livelli si aggiornano in base all'azione del prezzo
### 2. Punteggio di forza del livello
Ogni livello riceve un punteggio di forza (0-100%) basato su:
- **Conteggio dei tocchi** (40%) : Numero di volte in cui il prezzo ha testato il livello
- **Volume al livello** (30%) : Attività di trading vicino al livello
- **Rifiuto della candela** (20%) : Qualità dei rifiuti di prezzo
- **Freschezza del livello** (10%) : Quanto recentemente il livello è stato formato
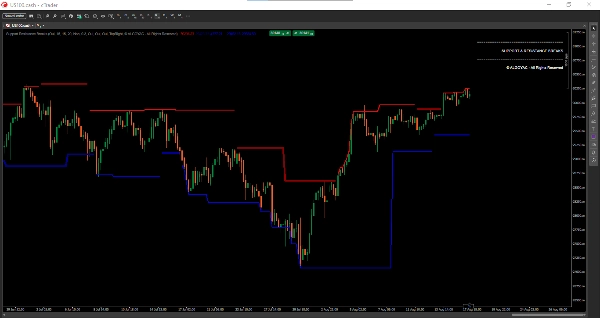
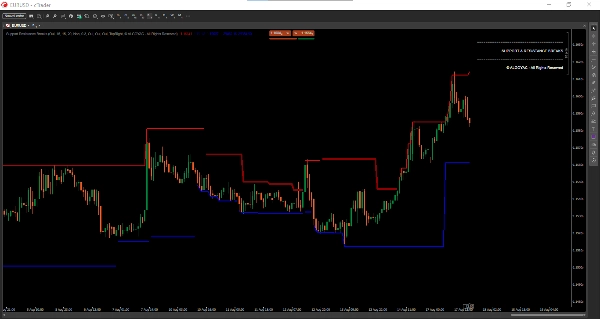
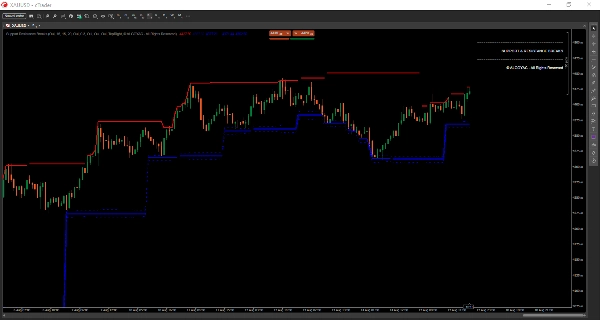
I livelli forti (>60%) sono mostrati con linee più spesse:
- **Rosso/Blu scuro** : Livelli forti (alta probabilità)
- **Rosso/Blu chiaro** : Livelli standard (probabilità moderata)
### 3. Zone di supporto/resistenza
- **Dimensione zona configurabile** : Basata sul moltiplicatore ATR
- **Zone visive** : Linee tratteggiate che mostrano l'intera larghezza della zona
- **Rappresentazione realistica** : Le zone riflettono meglio il comportamento reale del mercato rispetto alle singole linee
### 4. Punteggio di qualità del breakout
Ogni segnale di breakout include un punteggio di qualità (0-100%) basato su:
- **Conferma del volume** (30%) : Aumento del volume durante il breakout
- **Dimensione del corpo della candela** (25%) : Forza della candela di breakout
- **Posizione di chiusura** (25%) : Dove il prezzo ha chiuso rispetto al range
- **Forza del livello** (20%) : Importanza del livello rotto
**Colori di qualità :**
- **Lime** : Breakout di alta qualità (>70%)
- **Giallo** : Qualità moderata (40-70%)
- **Arancione** : Bassa qualità (<40%)
### 5. Segnali di breakout
- **Etichetta "B"** : Breakout con conferma del volume
- **"Bull Wick"** : Rifiuto rialzista del supporto
- **"Bear Wick"** : Rifiuto ribassista della resistenza
## 📈 Come interpretare i segnali
### Conferma del breakout
Un breakout di alta qualità (etichetta "B" lime) con volume forte suggerisce un breakout genuino. I breakout di bassa qualità (arancione) possono essere segnali falsi.
### Test del livello
Quando il prezzo testa ripetutamente un livello (molteplici tocchi), il livello guadagna forza. I livelli forti hanno maggiori probabilità di reggere o causare inversioni significative.
### Trading nelle zone
Invece di operare su livelli esatti, usa le zone. Entra vicino ai confini della zona, non nel mezzo.
### Analisi del volume
L'oscillatore di volume (EMA 5 vs EMA 10) aiuta a confermare la validità del breakout. I breakout con volume > soglia sono più affidabili.
## ⚙️ Impostazioni e parametri
### Gruppo Pivot Points
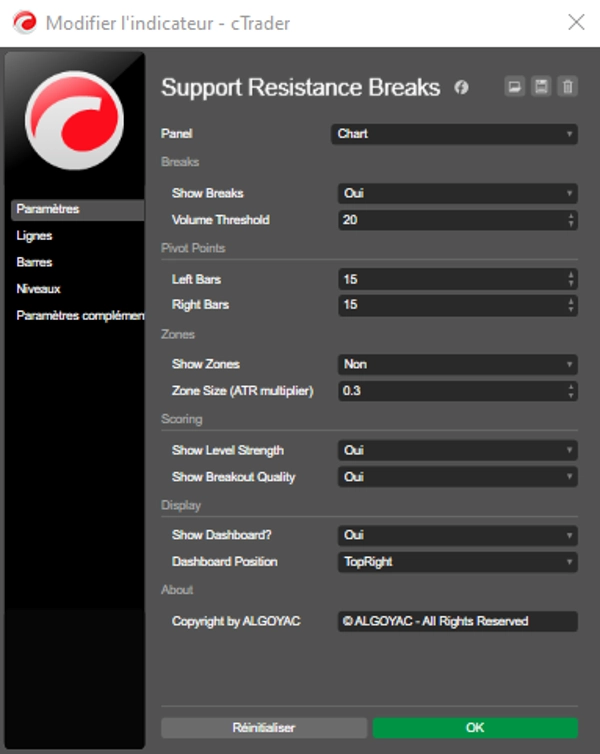
- **Barre a sinistra** (default: 15) : Numero di barre a sinistra per il rilevamento del pivot
- **Barre a destra** (default: 15) : Numero di barre a destra per la conferma del pivot
### Gruppo Breaks
- **Mostra Breaks** (default: true) : Mostra segnali di breakout
- **Soglia volume** (default: 20) : Valore minimo dell'oscillatore di volume per breakout validi
### Gruppo Zones
- **Mostra Zones** (default: true) : Mostra zone di supporto/resistenza
- **Dimensione zona** (default: 0.3) : Larghezza della zona come moltiplicatore ATR
### Gruppo Scoring
- **Mostra forza livello** (default: true) : Mostra livelli forti vs deboli
- **Mostra qualità breakout** (default: true) : Mostra punteggi di qualità sui breakout
## 💼 Casi d'uso tipici
### Day Trading
- Usare su timeframe M15-H1
- Entrare su breakout di alta qualità (etichette lime)
- Impostare stop oltre i confini della zona
- Prendere profitto al prossimo livello di supporto/resistenza
### Swing Trading
- Usare su timeframe H4-D1
- Concentrarsi su livelli forti (>60% di forza)
- Attendere che il prezzo raggiunga le zone prima di entrare
- Usare la qualità del breakout per conferma
### Scalping
- Usare su timeframe M1-M5
- Operare sui rimbalzi da livelli forti
- Entrate/uscite rapide ai confini della zona
- Conferma del volume essenziale
## 👥 Per chi è questo indicatore?
### Adatto a:
- **Trader di livelli** : Identificare e operare su livelli chiave
- **Trader di breakout** : Catturare breakout genuini con conferma di qualità
- **Trader di range** : Operare tra zone di supporto e resistenza
- **Trader di volume** : Usare l'analisi del volume per conferma
### Livello di esperienza:
- **Principianti** : Livelli e segnali visivi chiari
- **Intermedi** : Usare il punteggio per migliori entrate
- **Avanzati** : Combinare con analisi multi-timeframe
## ⚠️ Note importanti e limitazioni
1. **Breakout falsi** : Non tutti i breakout hanno successo. Usare punteggi di qualità e conferma del volume.
2. **Ridondanza dei livelli** : Troppi livelli in mercati volatili. Regolare le barre sinistra/destra di conseguenza.
3. **Larghezza della zona** : Le zone possono essere ampie in mercati con ATR elevato. Regolare il parametro Dimensione zona.
4. **Non standalone** : Meglio usato con altri indicatori (momentum, analisi di trend).
5. **Condizioni di mercato** : Funziona meglio in mercati trend. I mercati laterali possono produrre molti falsi segnali.
## 🔧 Impostazioni consigliate
| Tipo di mercato | Barre a sinistra | Barre a destra | Dimensione zona |
|-------------|-----------|------------|-----------|
| Forex | 15 | 15 | 0.3 |
| Azioni | 20 | 10 | 0.2 |
| Crypto | 25 | 15 | 0.5 |
| Indici | 15 | 10 | 0.3 |
## 🚀 Come iniziare
1. Aggiungi l'indicatore al tuo grafico
2. Osserva i livelli iniziali e la loro forza
3. Aspetta che il prezzo si avvicini a livelli forti
4. Guarda i segnali di breakout con punteggi di qualità
5. Entra su breakout di alta qualità (>70%)
6. Usa le zone per il posizionamento dello stop loss
---
Riepilogo
The indicator displays configurable support and resistance zones using ATR multipliers, providing a realistic market representation beyond single lines. Breakout signals include quality scores derived from volume surges, candle body size, close position, and level strength, with color-coded quality indicators (lime for high, yellow for moderate, orange for low).
Breakout signals are labeled ("B" for volume-confirmed breakouts, "Bull Wick" for bullish rejections, and "Bear Wick" for bearish rejections). Volume oscillators assist in confirming breakout validity. Settings allow customization of pivot detection bars, zone size, and display options.
Suitable for various trading styles—including day trading, swing trading, and scalping—this indicator supports multiple timeframes and markets such as Forex, stocks, crypto, and indices. It is intended for traders of all experience levels seeking to identify and trade key levels, breakouts, and ranges with volume-based confirmation.
Recensioni dei clienti
5 | 50 % | |
4 | 50 % | |
3 | 0 % | |
2 | 0 % | |
1 | 0 % |