
Beschreibung
Smart Liquidity Matrix markiert die Struktur, die institutioneller Orderflow hinterlässt, und behält eine
laufende Übersicht desselben Setups über vierundzwanzig Zeitrahmen gleichzeitig.
WAS ES ZEICHNET
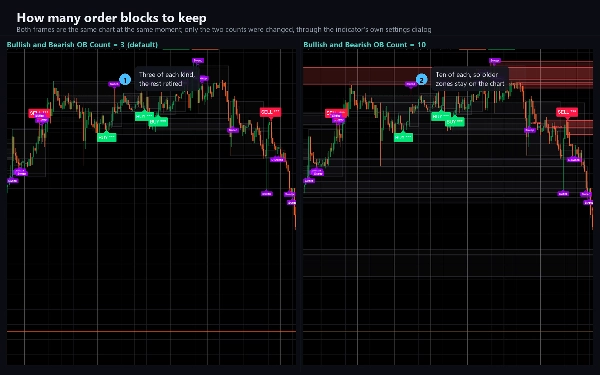
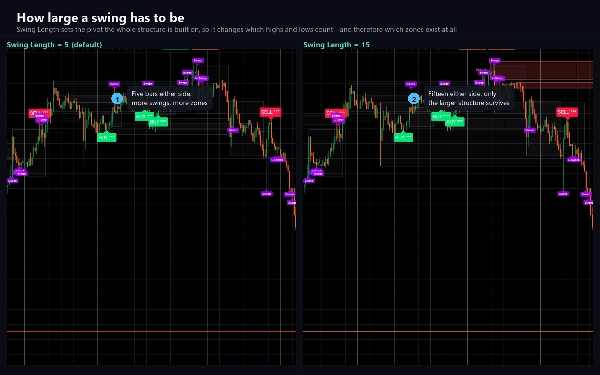
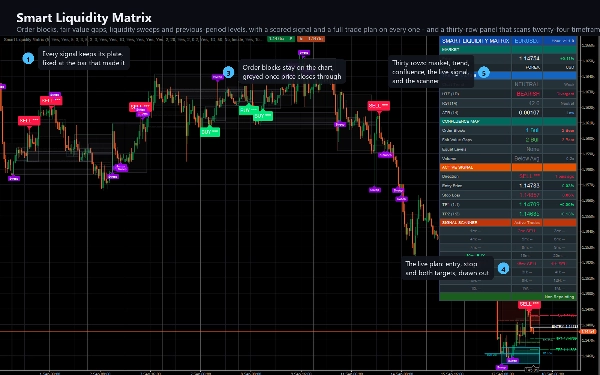
Orderblöcke. Bei jedem bestätigten Swing wird die letzte entgegengesetzte Kerze vor der Bewegung eingerahmt. Die Zone
bleibt aktiv, bis der Preis durch sie schließt, dann wird sie ausgegraut statt zu verschwinden, sodass Sie
immer noch sehen können, wo sie war.
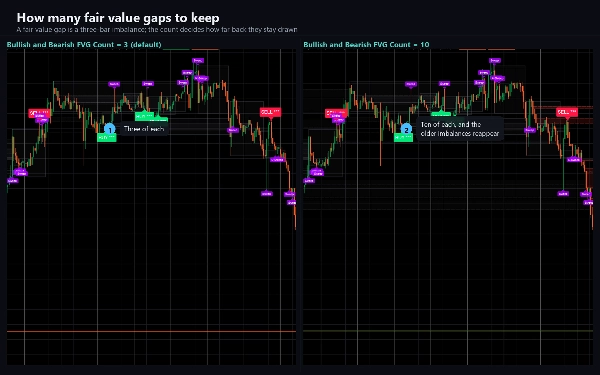
Fair Value Gaps. Drei-Kerzen-Ungleichgewichte, gezeichnet in dem Moment, in dem sie entstehen, und ausgegraut, wenn der Preis wieder
durch sie schließt.
Gleiche Hochs und Tiefs. Swings, die innerhalb eines Zehntels des aktuellen ATR übereinstimmen, werden mit einer gepunkteten
Linie verbunden und mit EQH oder EQL gekennzeichnet. Dies sind die Pools, nach denen Liquiditätssweeps suchen.
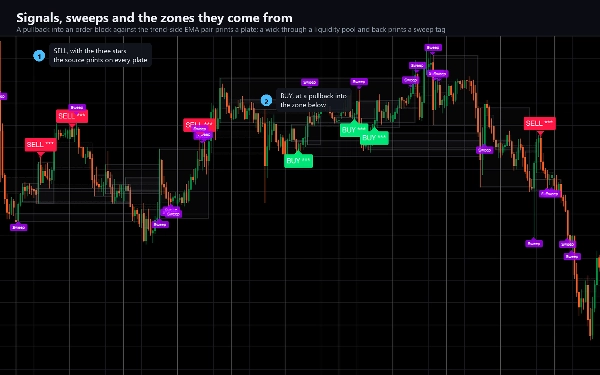
Liquiditätssweeps. Wenn der Preis durch ein gleiches Niveau oder das Hoch oder Tief der vorherigen Periode aussticht und
wieder innerhalb schließt, wird die Kerze markiert. Jeder Sweep kann einen Alarm auslösen.
Vorherige Perioden-Level und Gleichgewicht. Das Hoch und Tief des Vortages, mit eigenem Leuchten gezeichnet,
plus die Fünfzig-Prozent-Linie zwischen dem aktuellen Swing-Hoch und -Tief.
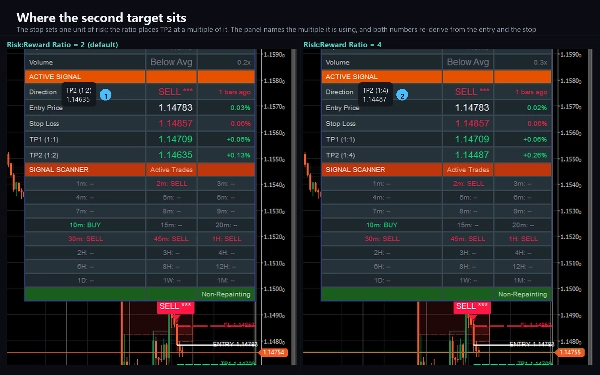
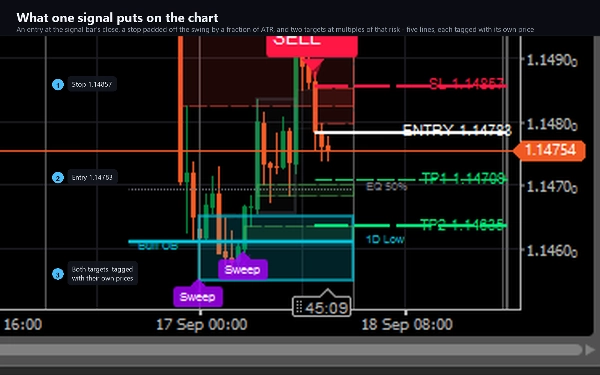
Kauf- und Verkaufssignale mit Risikobild. Ein Pullback-Einstieg gegen das Trend-seitige EMA-Paar, mit
Einstieg, Stopp und zwei Zielen, die rechts von der Kerze eingezeichnet und mit ihren Preisen beschriftet sind.
DER SCANNER
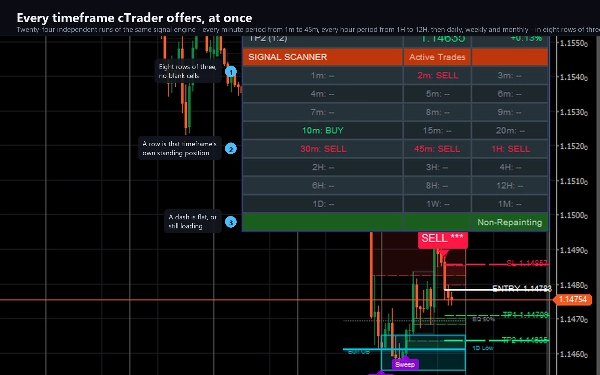
Das untere Drittel des Dashboards führt dieselbe Signallogik auf vierundzwanzig Zeitrahmen
unabhängig aus, von einer Minute bis zu einem Monat, und zeigt an, ob jeder aktuell eine Long-, eine
Short-Position oder keine hält. Die Übereinstimmung benachbarter Reihen ist entscheidend: Ein Verkaufssignal auf dreißig,
fünfundvierzig Minuten und einer Stunde zusammen liest sich ganz anders als ein einzelnes Signal in einer Reihe.
Diese vierundzwanzig sind alle Standard-Zeiträume, die cTrader bietet: eins, zwei, drei, vier, fünf, sechs,
sieben, acht, neun, zehn, fünfzehn, zwanzig, dreißig und fünfundvierzig Minuten, dann eins, zwei, drei, vier,
sechs, acht und zwölf Stunden, dann täglich, wöchentlich und monatlich. Alle werden aus denselben Kerzendaten
wie das Chart gelesen, sodass hier nichts von der Tick-Historie Ihres Brokers abhängt, und sie füllen genau acht Reihen mit je drei
Zellen ohne Leerstellen.
DAS DASHBOARD
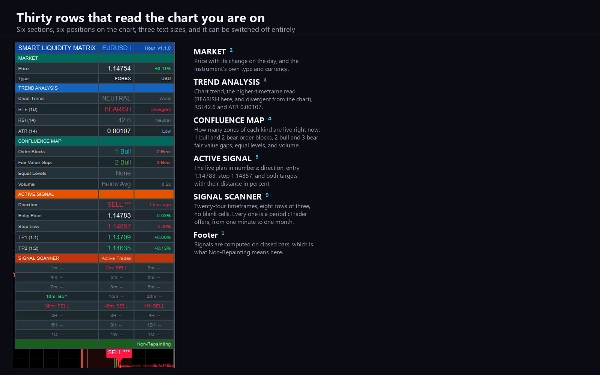
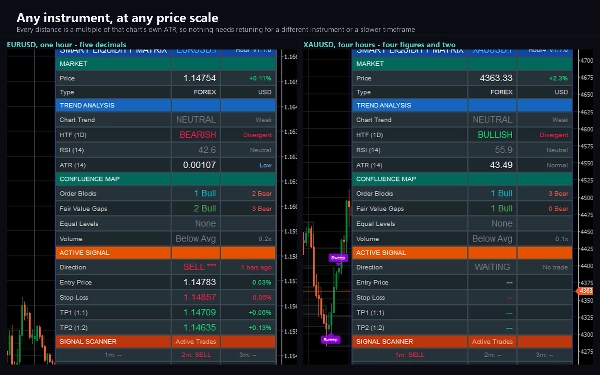
Dreißig Reihen in sechs Abschnitten: Markt, Trendanalyse, Konfluenzkarte, aktives Signal, der
Scanner und eine Fußzeile. Sechs Positionen, drei Textgrößen, und es kann komplett ausgeschaltet werden. Die Zeilenhöhe
ist auf ein cTrader-Chartfenster abgestimmt, das typischerweise kürzer als ein Browser-Chart ist.
ALERTE UND AUTOMATISIERUNG
Protokoll-, Ton- und E-Mail-Benachrichtigungen bei Signalen, Strukturevents und Sweeps, dedupliziert, sodass eine Kerze
eine Nachricht auslöst. Ein integrierter Webhook sendet dieselben Ereignisse als JSON an jede von Ihnen gewählte Adresse, über
den eigenen Netzwerkdienst von cTrader, sodass ein Bot oder ein Journal darauf reagieren kann. Er bleibt aus, bis Sie
eine Adresse eingeben, feuert nie während das Indikator die Historie lädt, nie in einem Backtest und ist
rate-begrenzt.
Der Indikator benötigt keine erhöhten Berechtigungen. Er kann Ihre Dateien nicht lesen oder einen Prozess starten.
EINSTELLUNGEN
Siebzig Parameter in sechzehn Gruppen. Jede Zonenanzahl, Farbe, Zeitrahmen und Beschriftungsposition ist
anpassbar, und ein Lite-Modus reduziert jede Linie für ein saubereres Chart.
GEEIGNET FÜR
Forex, Indizes, Metalle und Krypto-CFDs. Jeder Zeitrahmen; die Standardwerte wurden auf eine Stunde gesetzt. Der
Scanner-Bereich ist am informativsten zwischen fünf Minuten und vier Stunden.
WAS ES NICHT TUT
Es platziert, ändert oder schließt keine Orders. Es ist ein Analyse- und Alarmwerkzeug. Signale werden
nur auf geschlossenen Kerzen berechnet und nicht neu gezeichnet.
Trading beinhaltet Risiken. Vergangene Leistungen garantieren keine zukünftigen Ergebnisse.
Zusammenfassung
A unique feature is its 24-timeframe signal scanner, which independently analyzes from one minute to monthly intervals, showing long, short, or neutral signals to identify multi-timeframe agreement. The dashboard organizes information into six sections including market data, trend analysis, confluence, active signals, and the scanner, optimized for cTrader’s chart pane.
Alerts can be configured for signals, structure events, and sweeps, with options for log, sound, email, and webhook notifications for automation or journaling. The indicator uses closed bars only and does not repaint. It offers extensive customization with seventy adjustable parameters and a Lite Mode for cleaner visuals. It does not execute trades but serves as an analytical and alerting tool.
Kundenbewertungen
5 | 100 % | |
4 | 0 % | |
3 | 0 % | |
2 | 0 % | |
1 | 0 % |