
sma color
Indicator
191 downloads
Version 1.0, Apr 2025
Windows, Mac

Description
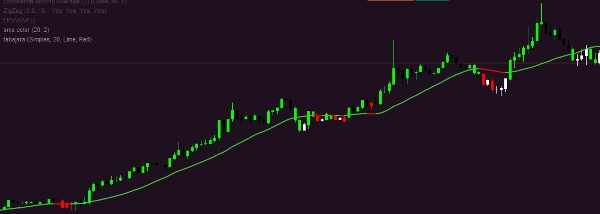
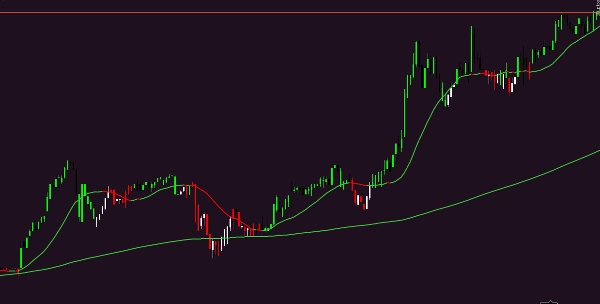
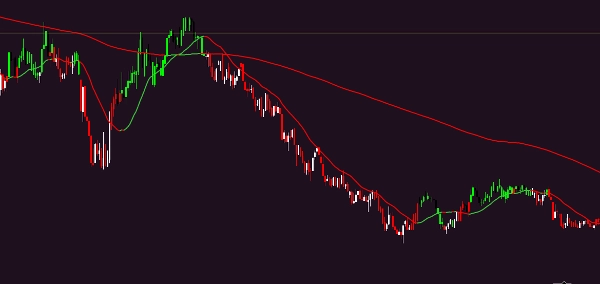
sma color
Summary
AI summary
The "sma color" indicator is a technical analysis tool designed to display a simple moving average (SMA) with color differentiation. It visually represents the SMA line on trading charts, potentially using color changes to indicate different market conditions or trends. This indicator aids traders in identifying trend direction and momentum by smoothing price data over a specified period. It is compatible with various trading instruments and timeframes, providing a clear and straightforward way to analyze price movements.
Indicator profile
Customer reviews
0.0
Reviews: 0
Customer reviews
No reviews for this product yet. Already tried it? Be the first to tell others!
Discussion
FAQ
Products available through cTrader Store, including trading bots, indicators and plugins, are provided by third-party developers and made available for informational and technical access purposes only. cTrader Store is not a broker and does not provide investment advice, personal recommendations or any guarantee of future performance.
More from this author


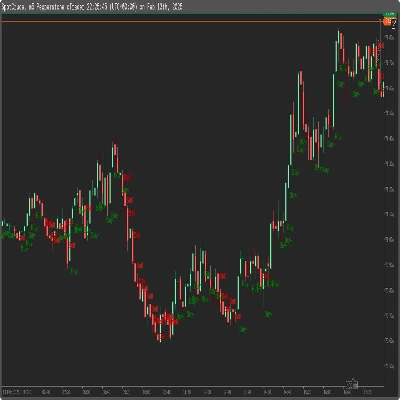
!["Tabajara corrigido[fix]" logo](https://cdn.ctrader.com/image/webp/7f4bbef8-b245-4ebd-80d7-582fffc0c90c_28378)


Price
Since 10/02/2025
1.25K
Free installs