High TF Plotter
5.0
03/09/2025
136
Desktop
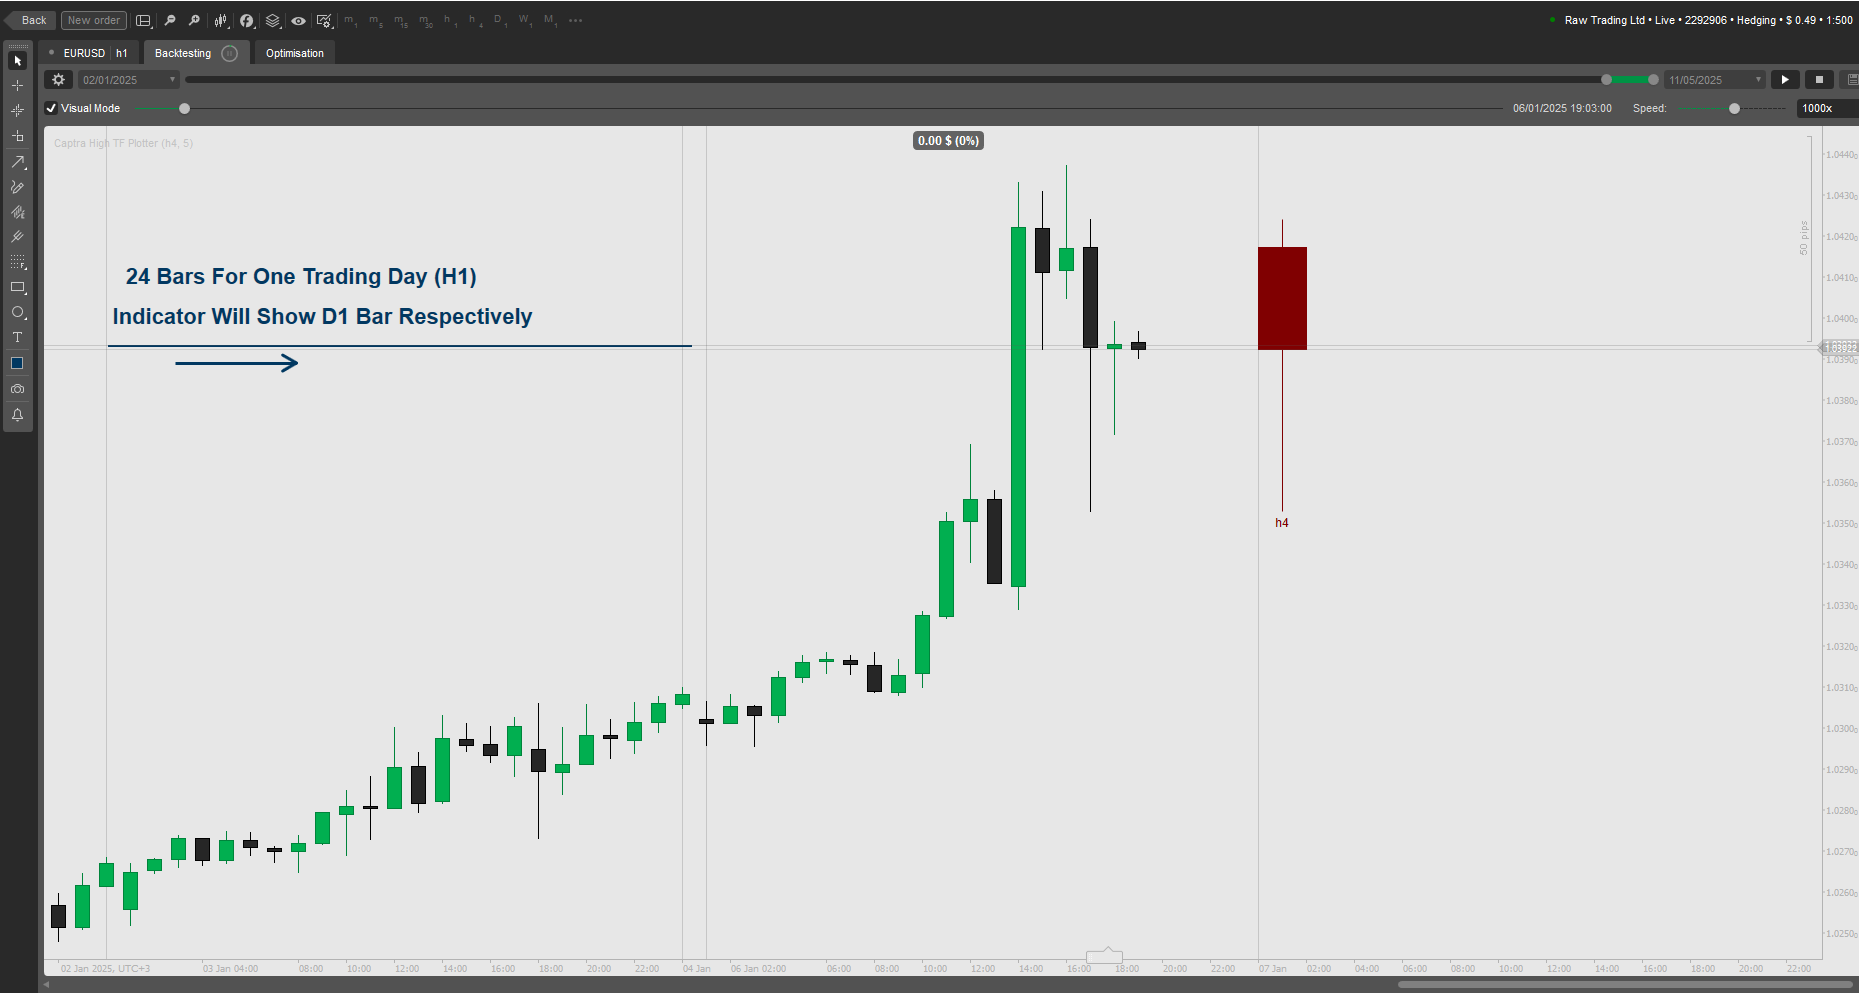
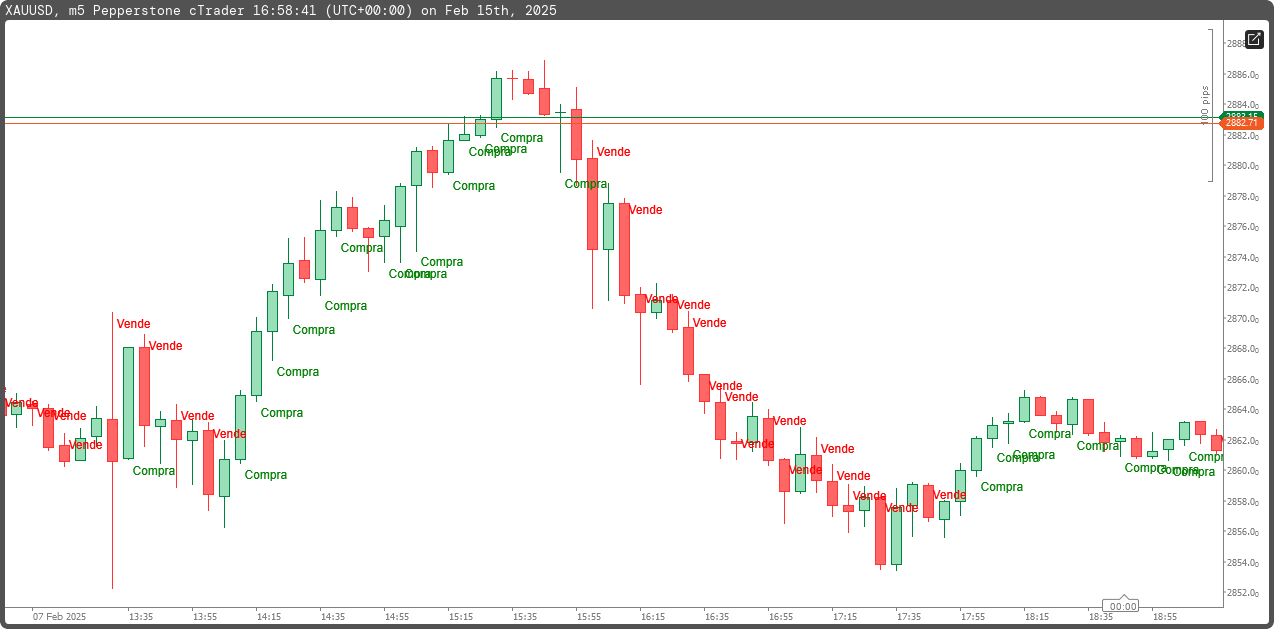
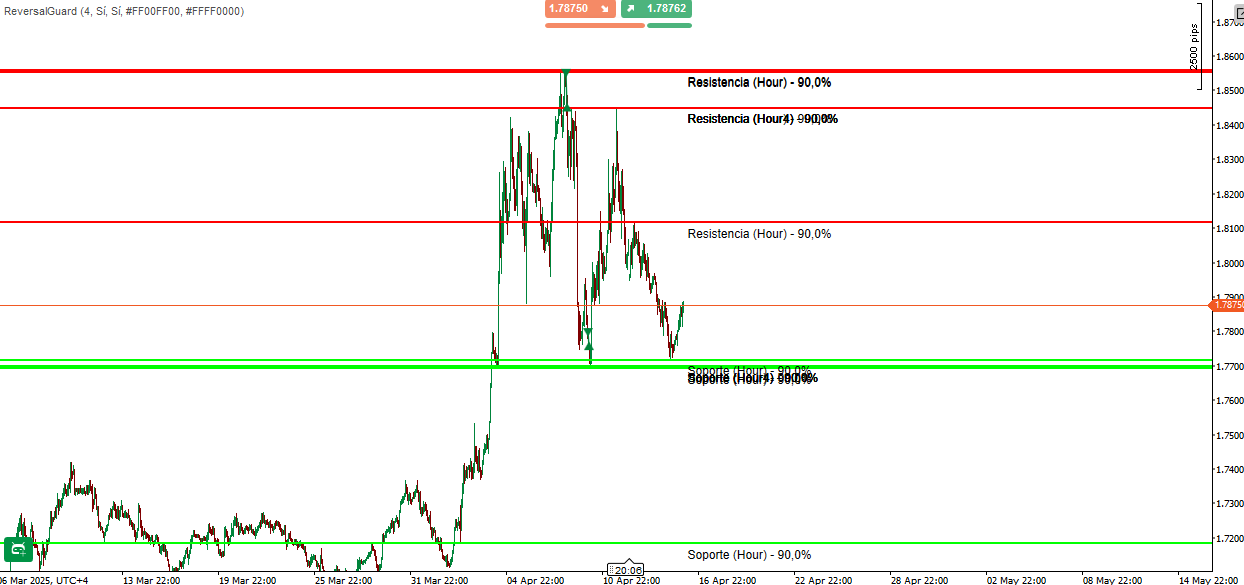
Plots high TF price action on lower TF charts. Shows open/close, wicks, and key zones with bull/bear colors. Customizable.
Key Features:
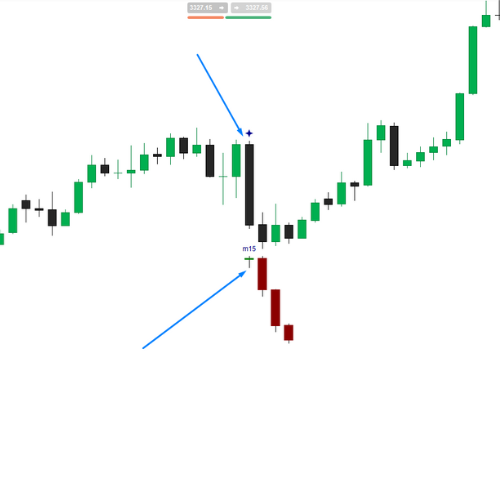
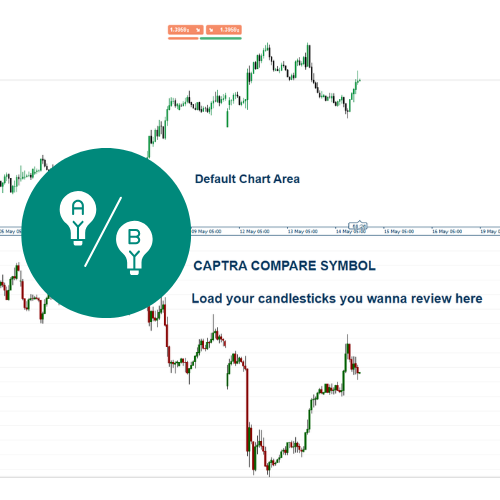
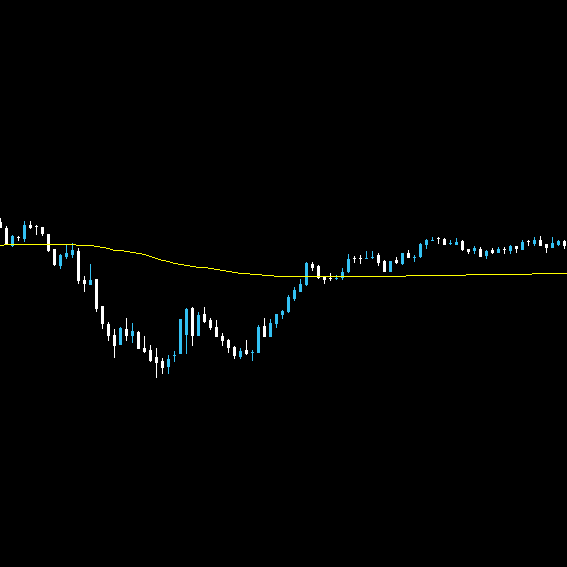
- Overlays high timeframe (e.g., Daily) price action on lower timeframe charts.
- Displays open/close price rectangles with customizable bull/bear colors.
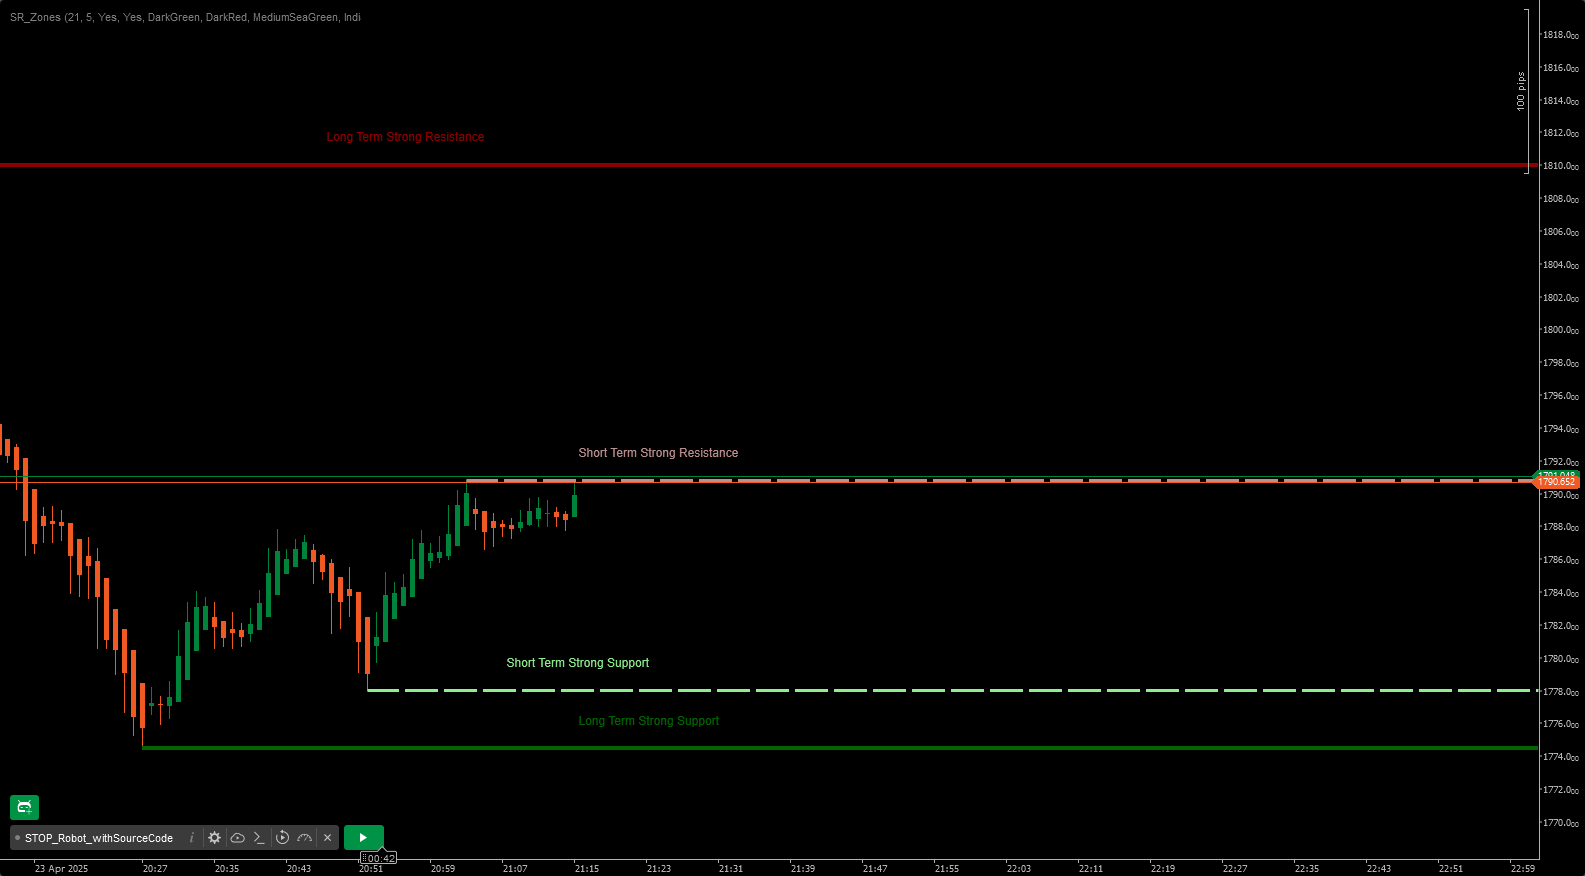
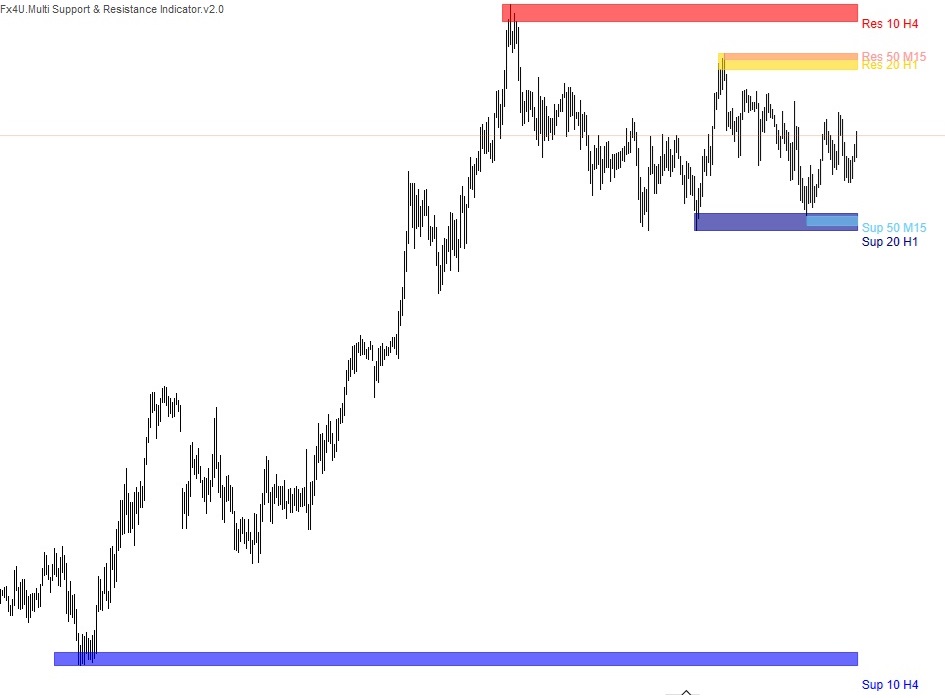
- Highlights wick premium/discount zones for key price levels.
- Configurable margin for chart spacing.
- Error handling for invalid timeframe settings.
Please leave a review to let us know if it’s helpful.
More from this author
You may also like
!["[Stellar Strategies] Visual Trend Momentum" logo](https://market-prod-23f4d22-e289.s3.amazonaws.com/3835d044-1c21-4909-9d3c-2635f984b93d_visualtrendmomentum.jpg)
.jpg)


.jpg)