support and resistance
23/09/2025
3
Desktop
Since 30/05/2025
Sales
10
Key Features:
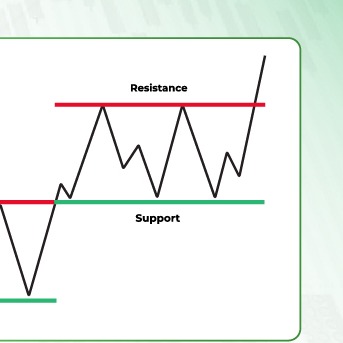
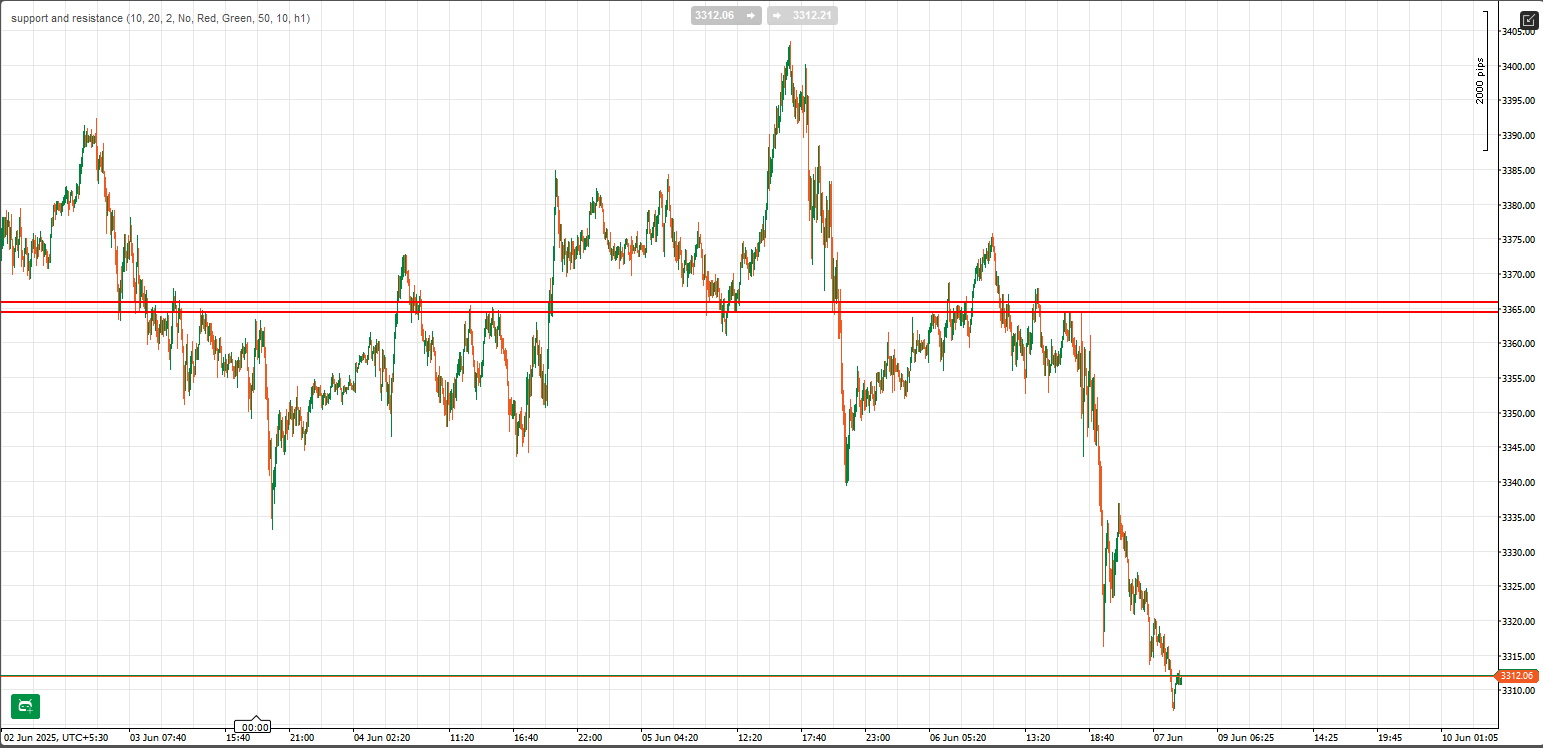
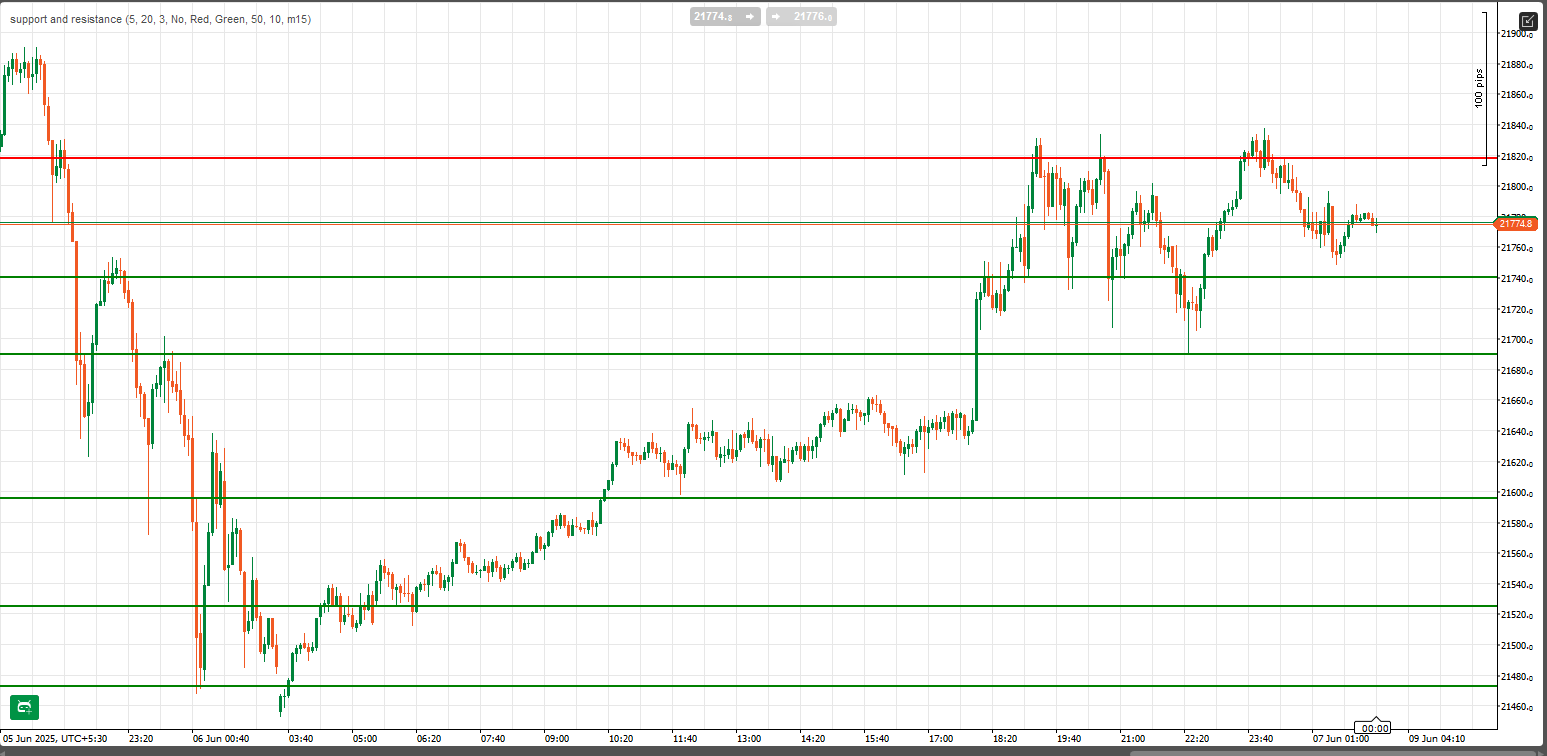
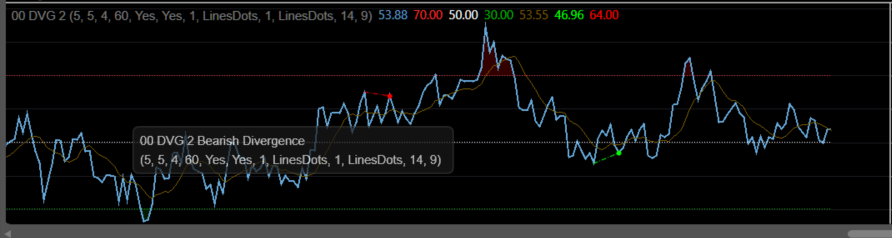
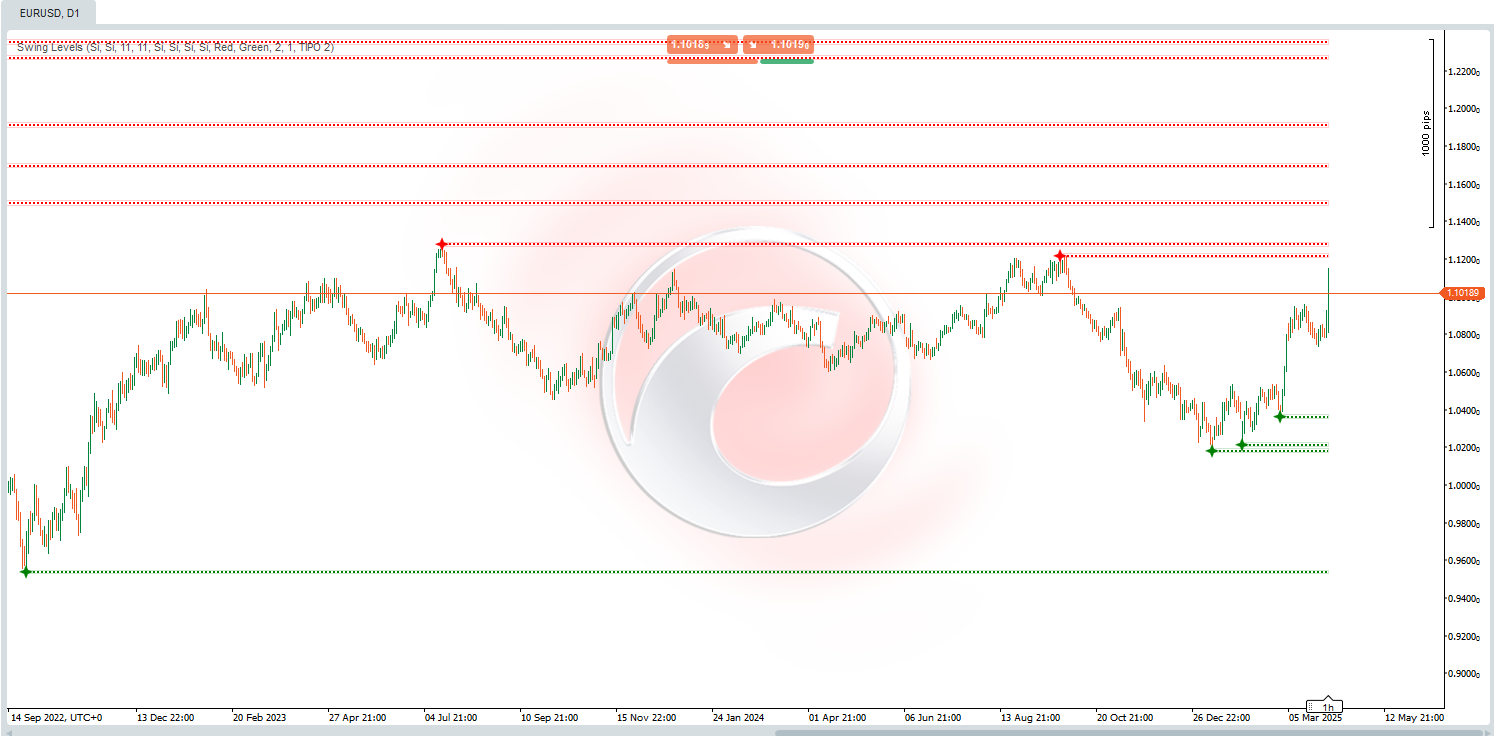
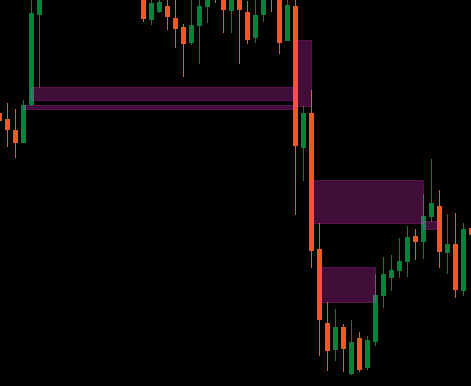
- Automatic Detection of Support and Resistance: The indicator automatically identifies significant support and resistance levels based on price action, highlighting these zones where the price has reversed or stalled multiple times.
- Bounce Count Validation: Support and resistance levels are validated based on the number of bounces (price reactions) from the level. The more bounces, the stronger the level. You can adjust the minimum bounce count for a level to be considered valid, ensuring that only highly significant levels are marked.
- Adjustable Line Styles: The thickness and style of support and resistance lines are automatically adjusted based on the bounce count. Levels with more bounces are drawn with thicker, more prominent lines, visually emphasizing their importance.
- Zone Width (Pips): You can define a buffer zone around support and resistance levels in pips. This helps in identifying price action within a range where the price could potentially reverse or react.
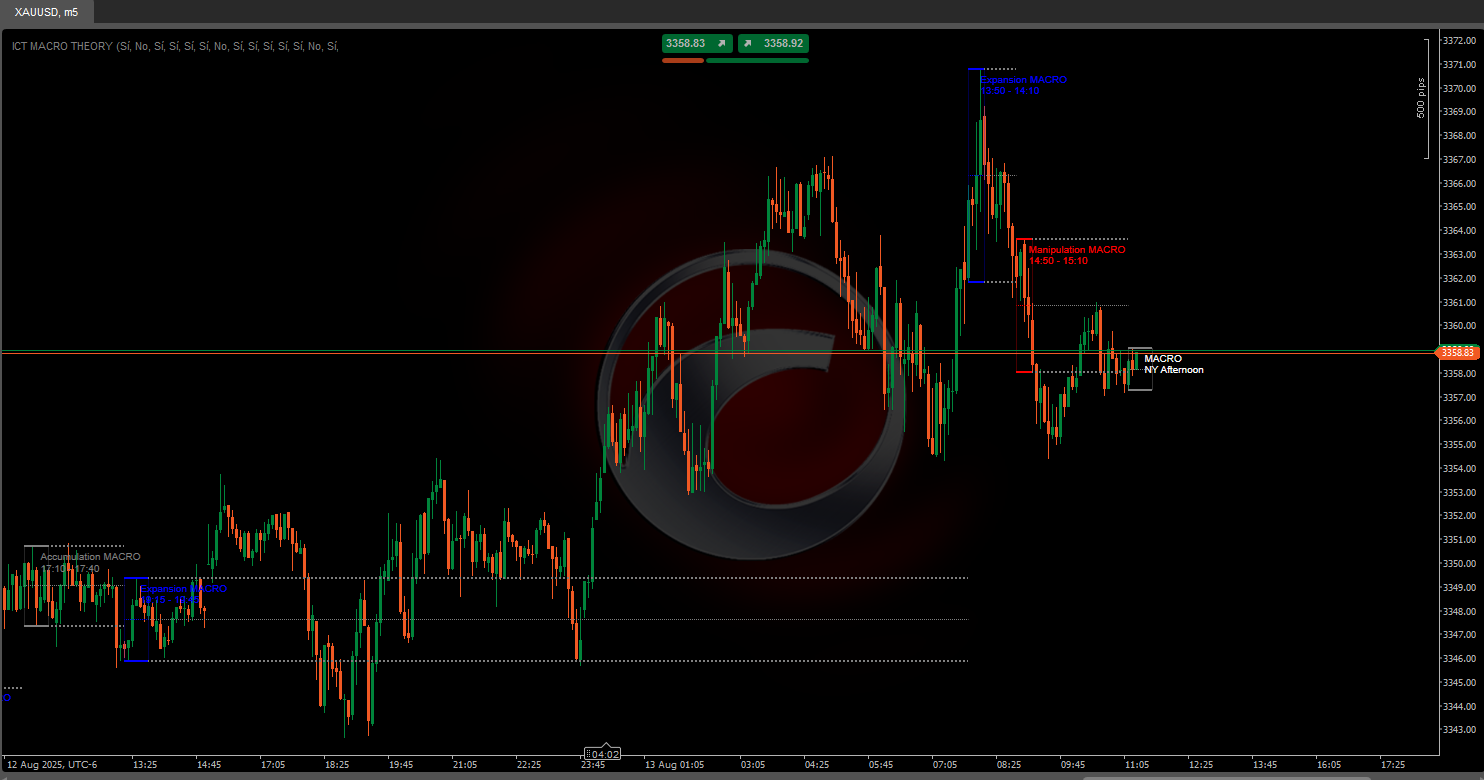
- Higher Timeframe Filter: A unique feature of this indicator is its ability to validate support and resistance levels using a higher timeframe filter. By selecting a higher timeframe (e.g., 1H, 4H), the indicator cross-checks the identified levels against key price action on the higher timeframe, ensuring that only significant levels are drawn on the chart.
- Alerts: When price enters the zone of a support or resistance level, the indicator can alert you with an audio sound, so you never miss an important price reaction.
- Customizable Colors: You can easily change the color of support and resistance lines to suit your preferences or align with your trading theme.
- Overlap Prevention: The indicator includes a threshold filter that prevents drawing overlapping support and resistance levels that are too close to each other, ensuring that only unique and important levels are displayed.
Benefits:
- Save Time: Automatically detect and visualize key support and resistance levels without manually drawing them.
- Clear Visuals: Easily see which support and resistance levels are the most significant based on price bounces and higher timeframe validation.
- Effective Alerts: Receive timely alerts when price action enters important levels, helping you to act quickly and efficiently.
- Improved Trading Decisions: Use this indicator to gain more confidence in your entries and exits, as well as your overall technical analysis.
Customization Options:
- Lookback Bars: Adjust how far back the indicator looks to identify potential support and resistance levels.
- Minimum Bounces: Set the minimum number of bounces required for a level to be considered valid.
- Higher Timeframe: Filter support and resistance levels based on a higher timeframe (e.g., 1-hour, 4-hour charts).
- Line Color: Choose colors for resistance and support lines to suit your chart style.
- Alert Settings: Enable or disable alerts based on price entering support or resistance zones.
More from this author
.jpg)
You may also like
!["[Stellar Strategies] Inside Bar with Signals" logo](https://market-prod-23f4d22-e289.s3.amazonaws.com/c12d088e-7b52-4961-a0d2-7e38a2499bd3_cT_cs_4141285_EURUSD_2025-07-15_13-15-32.png)


.png)