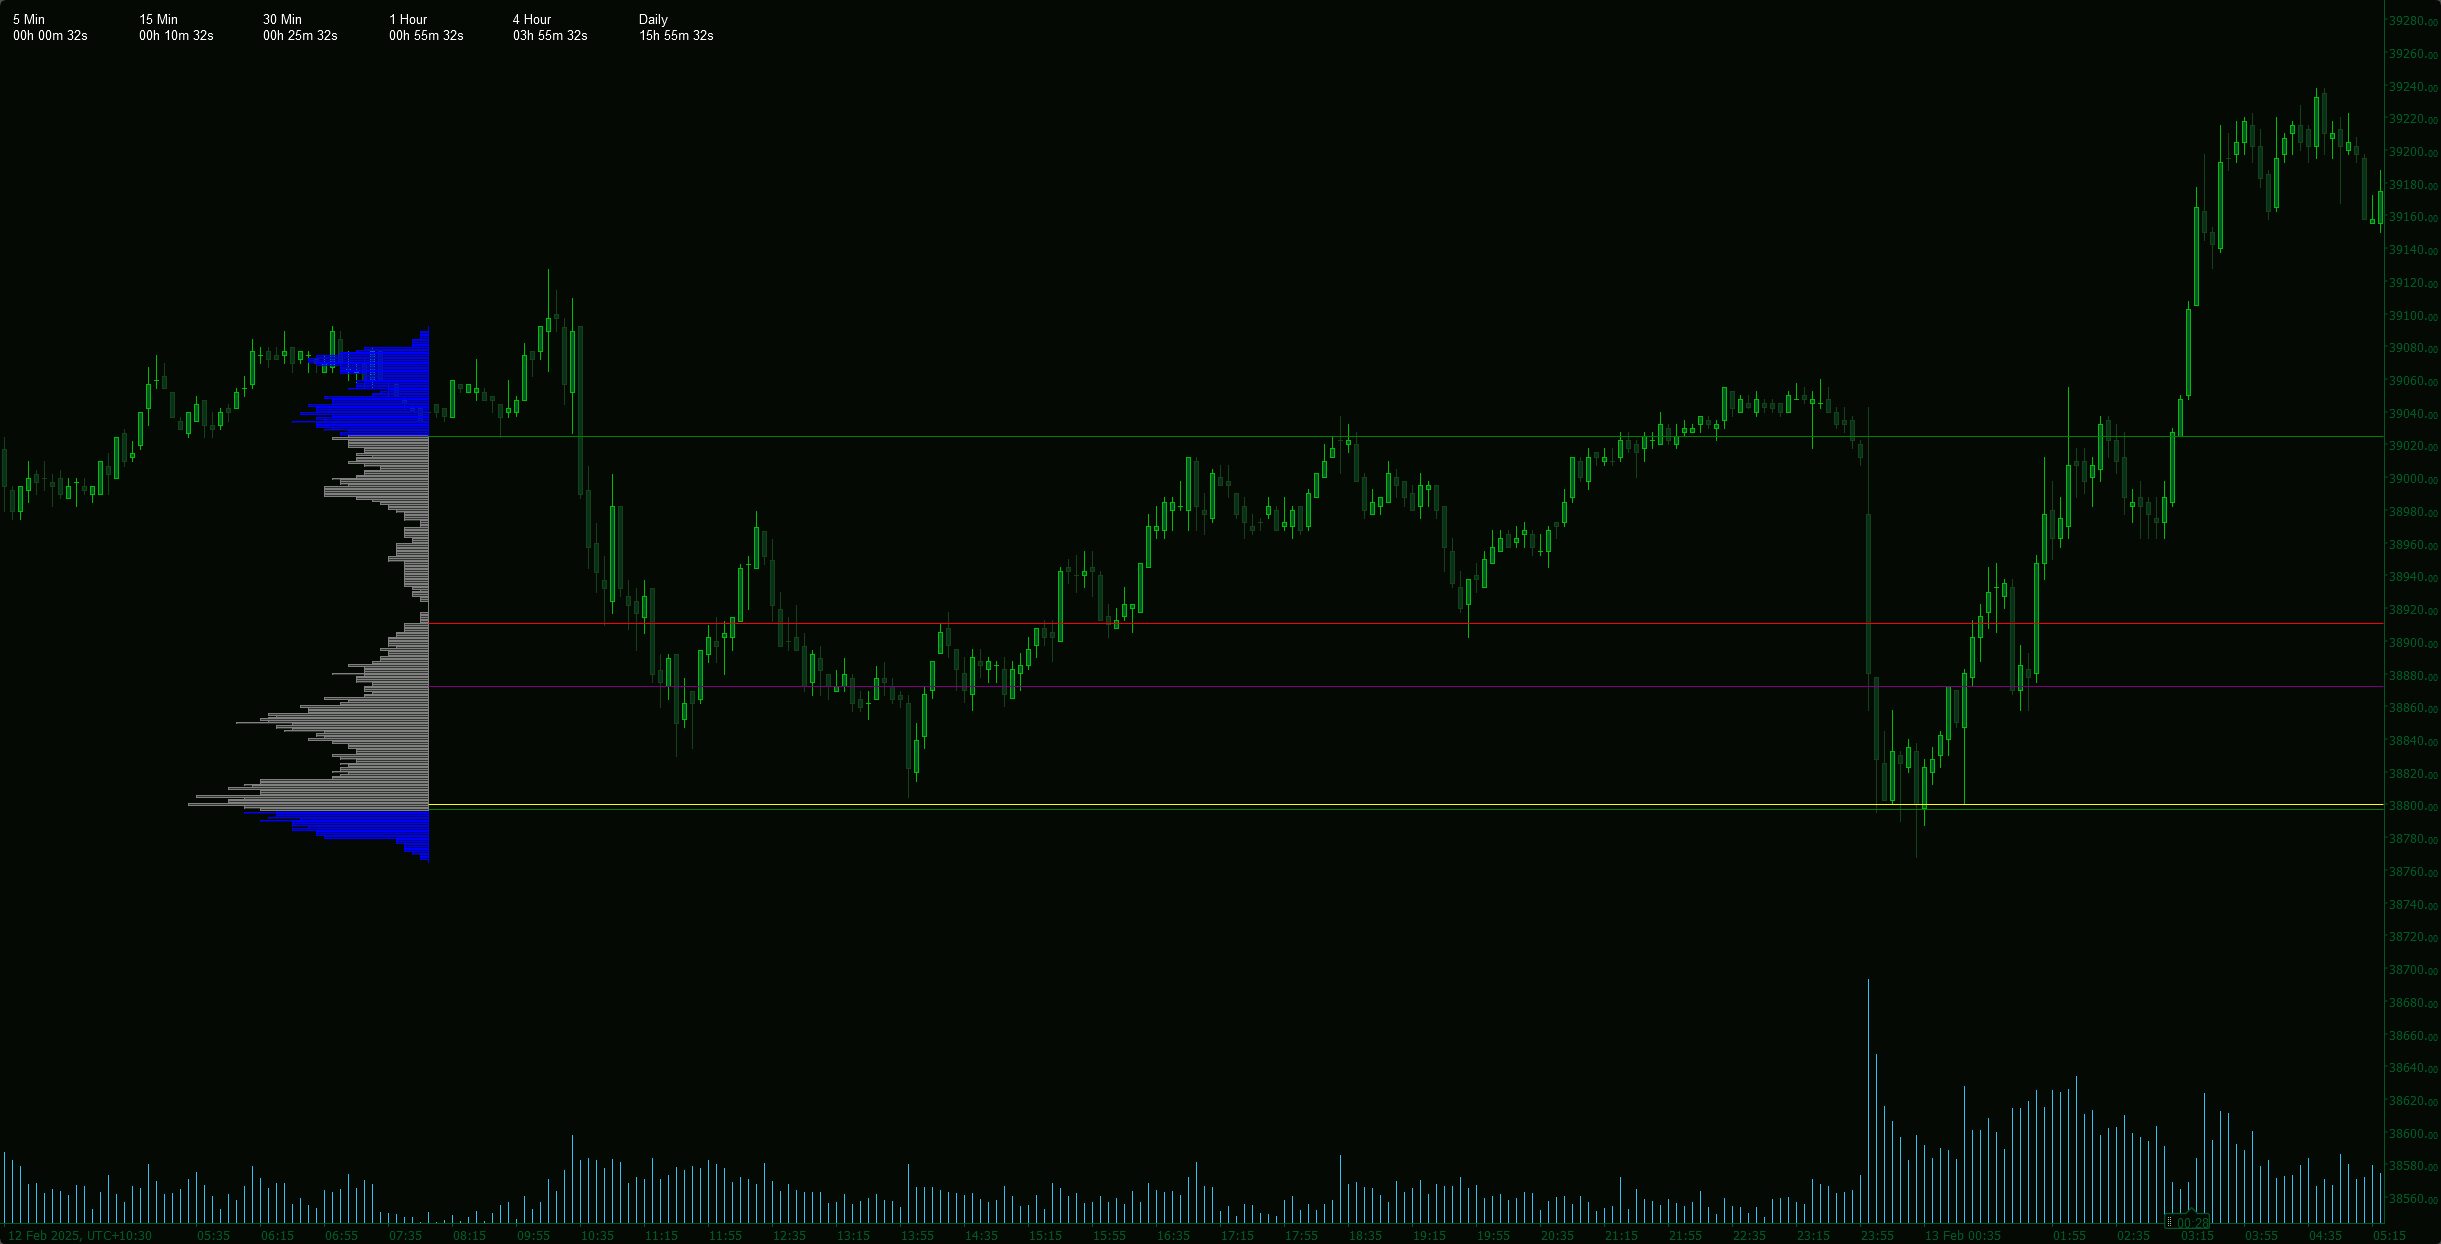
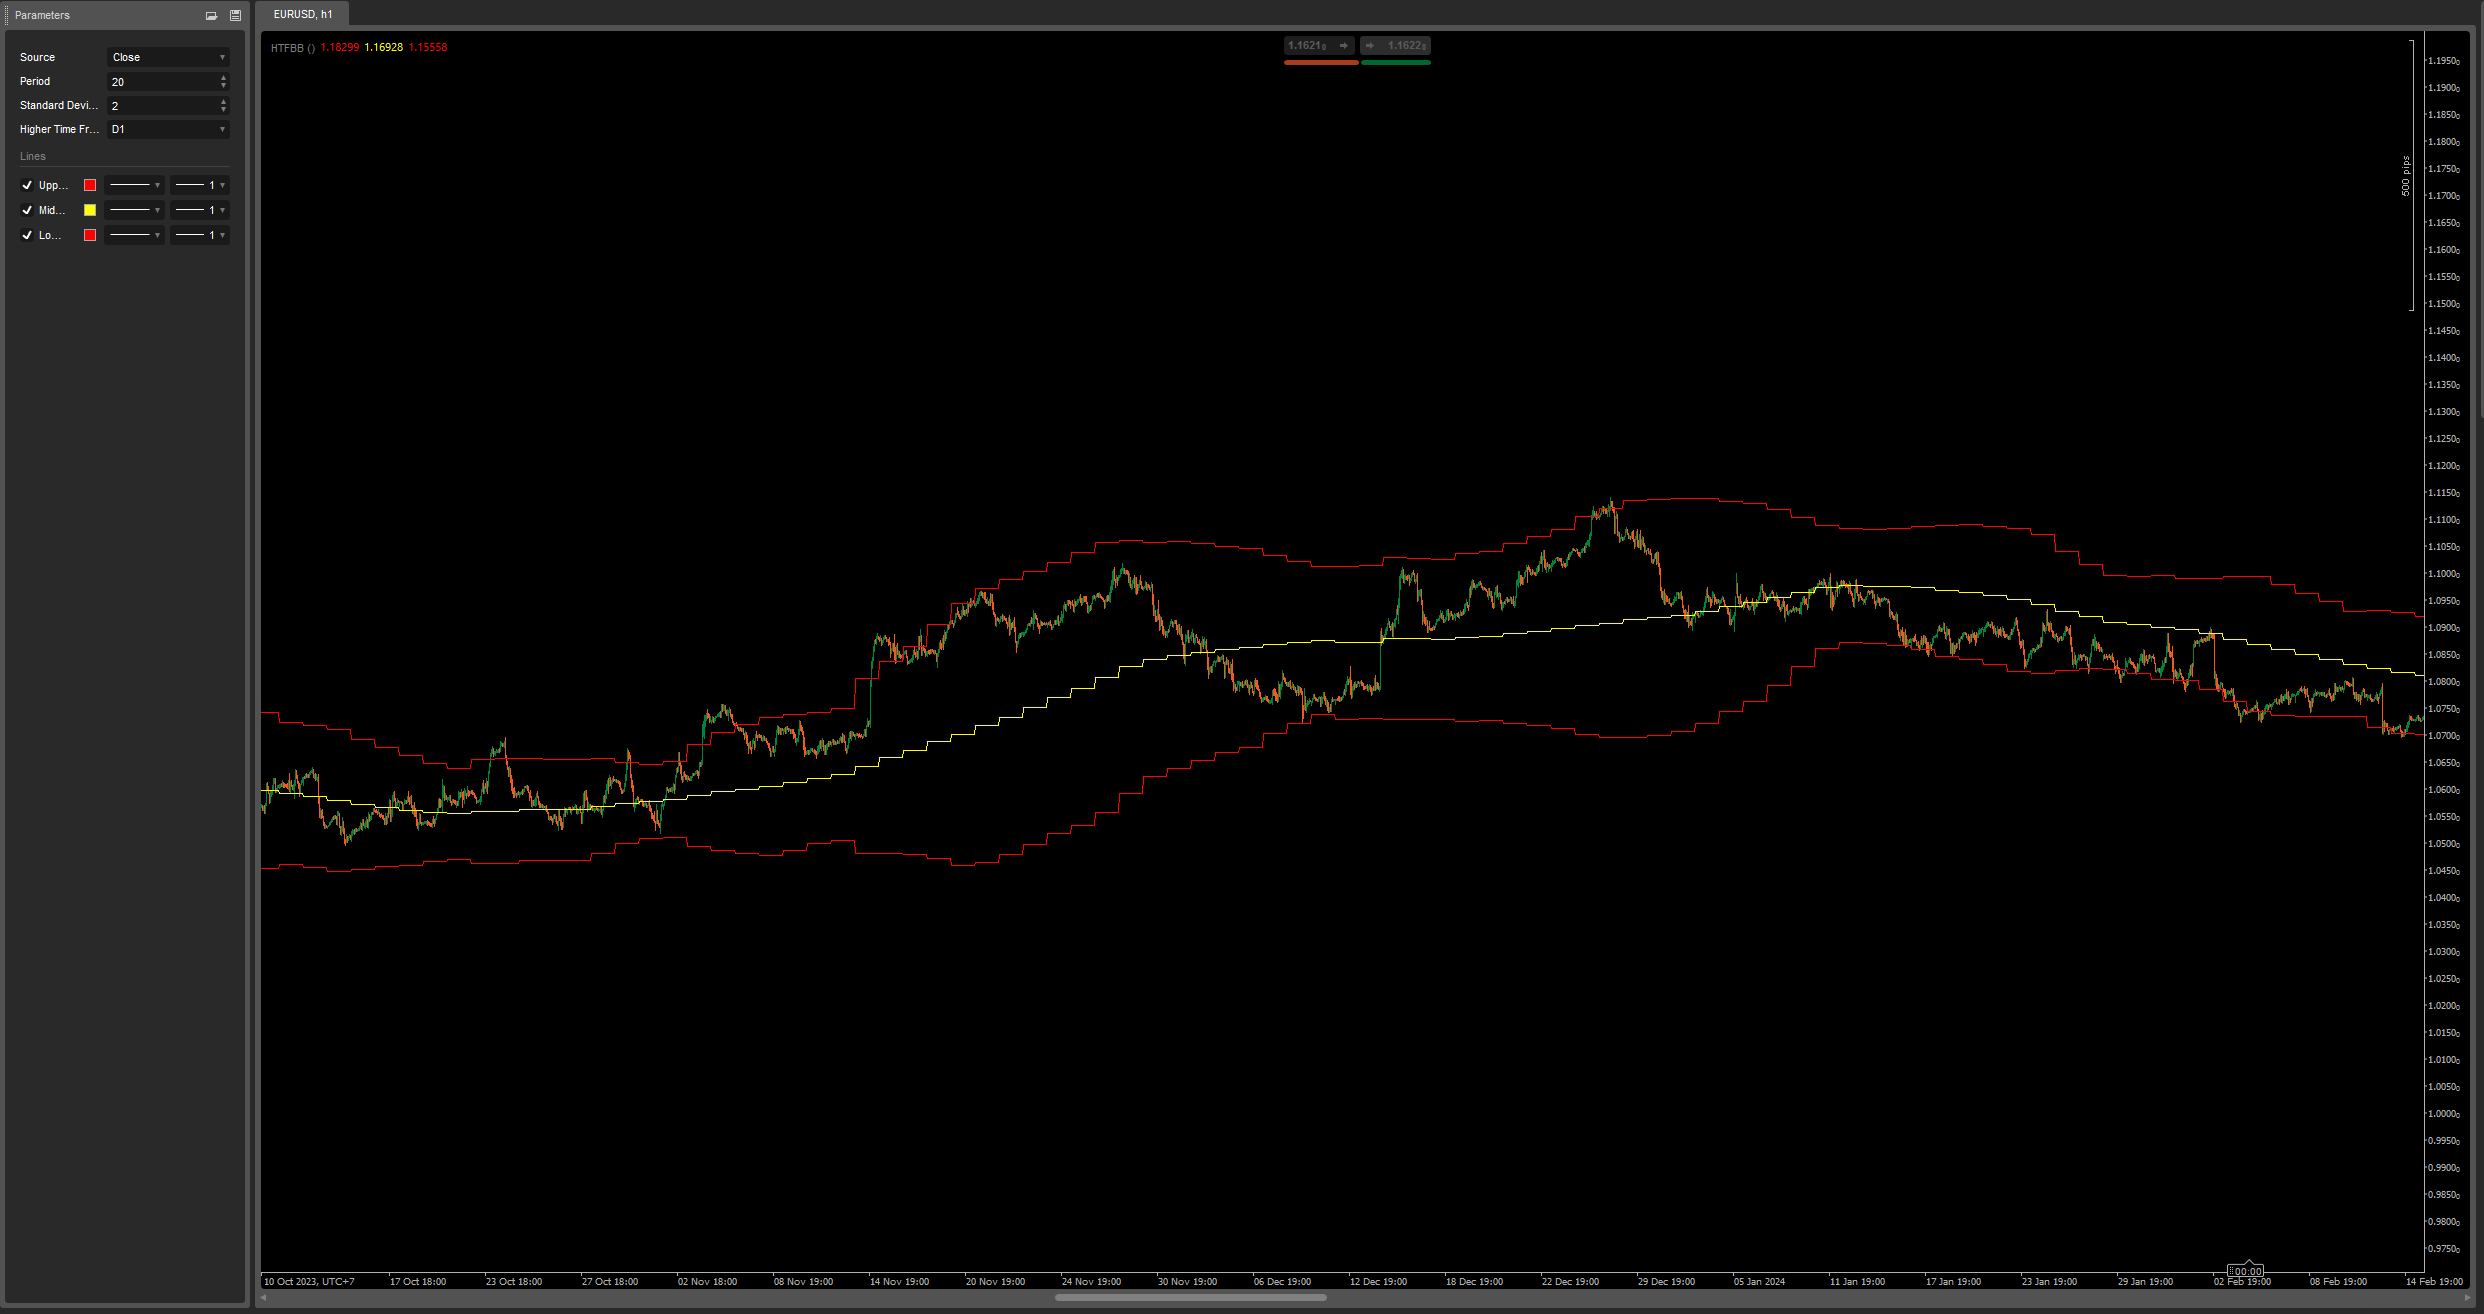
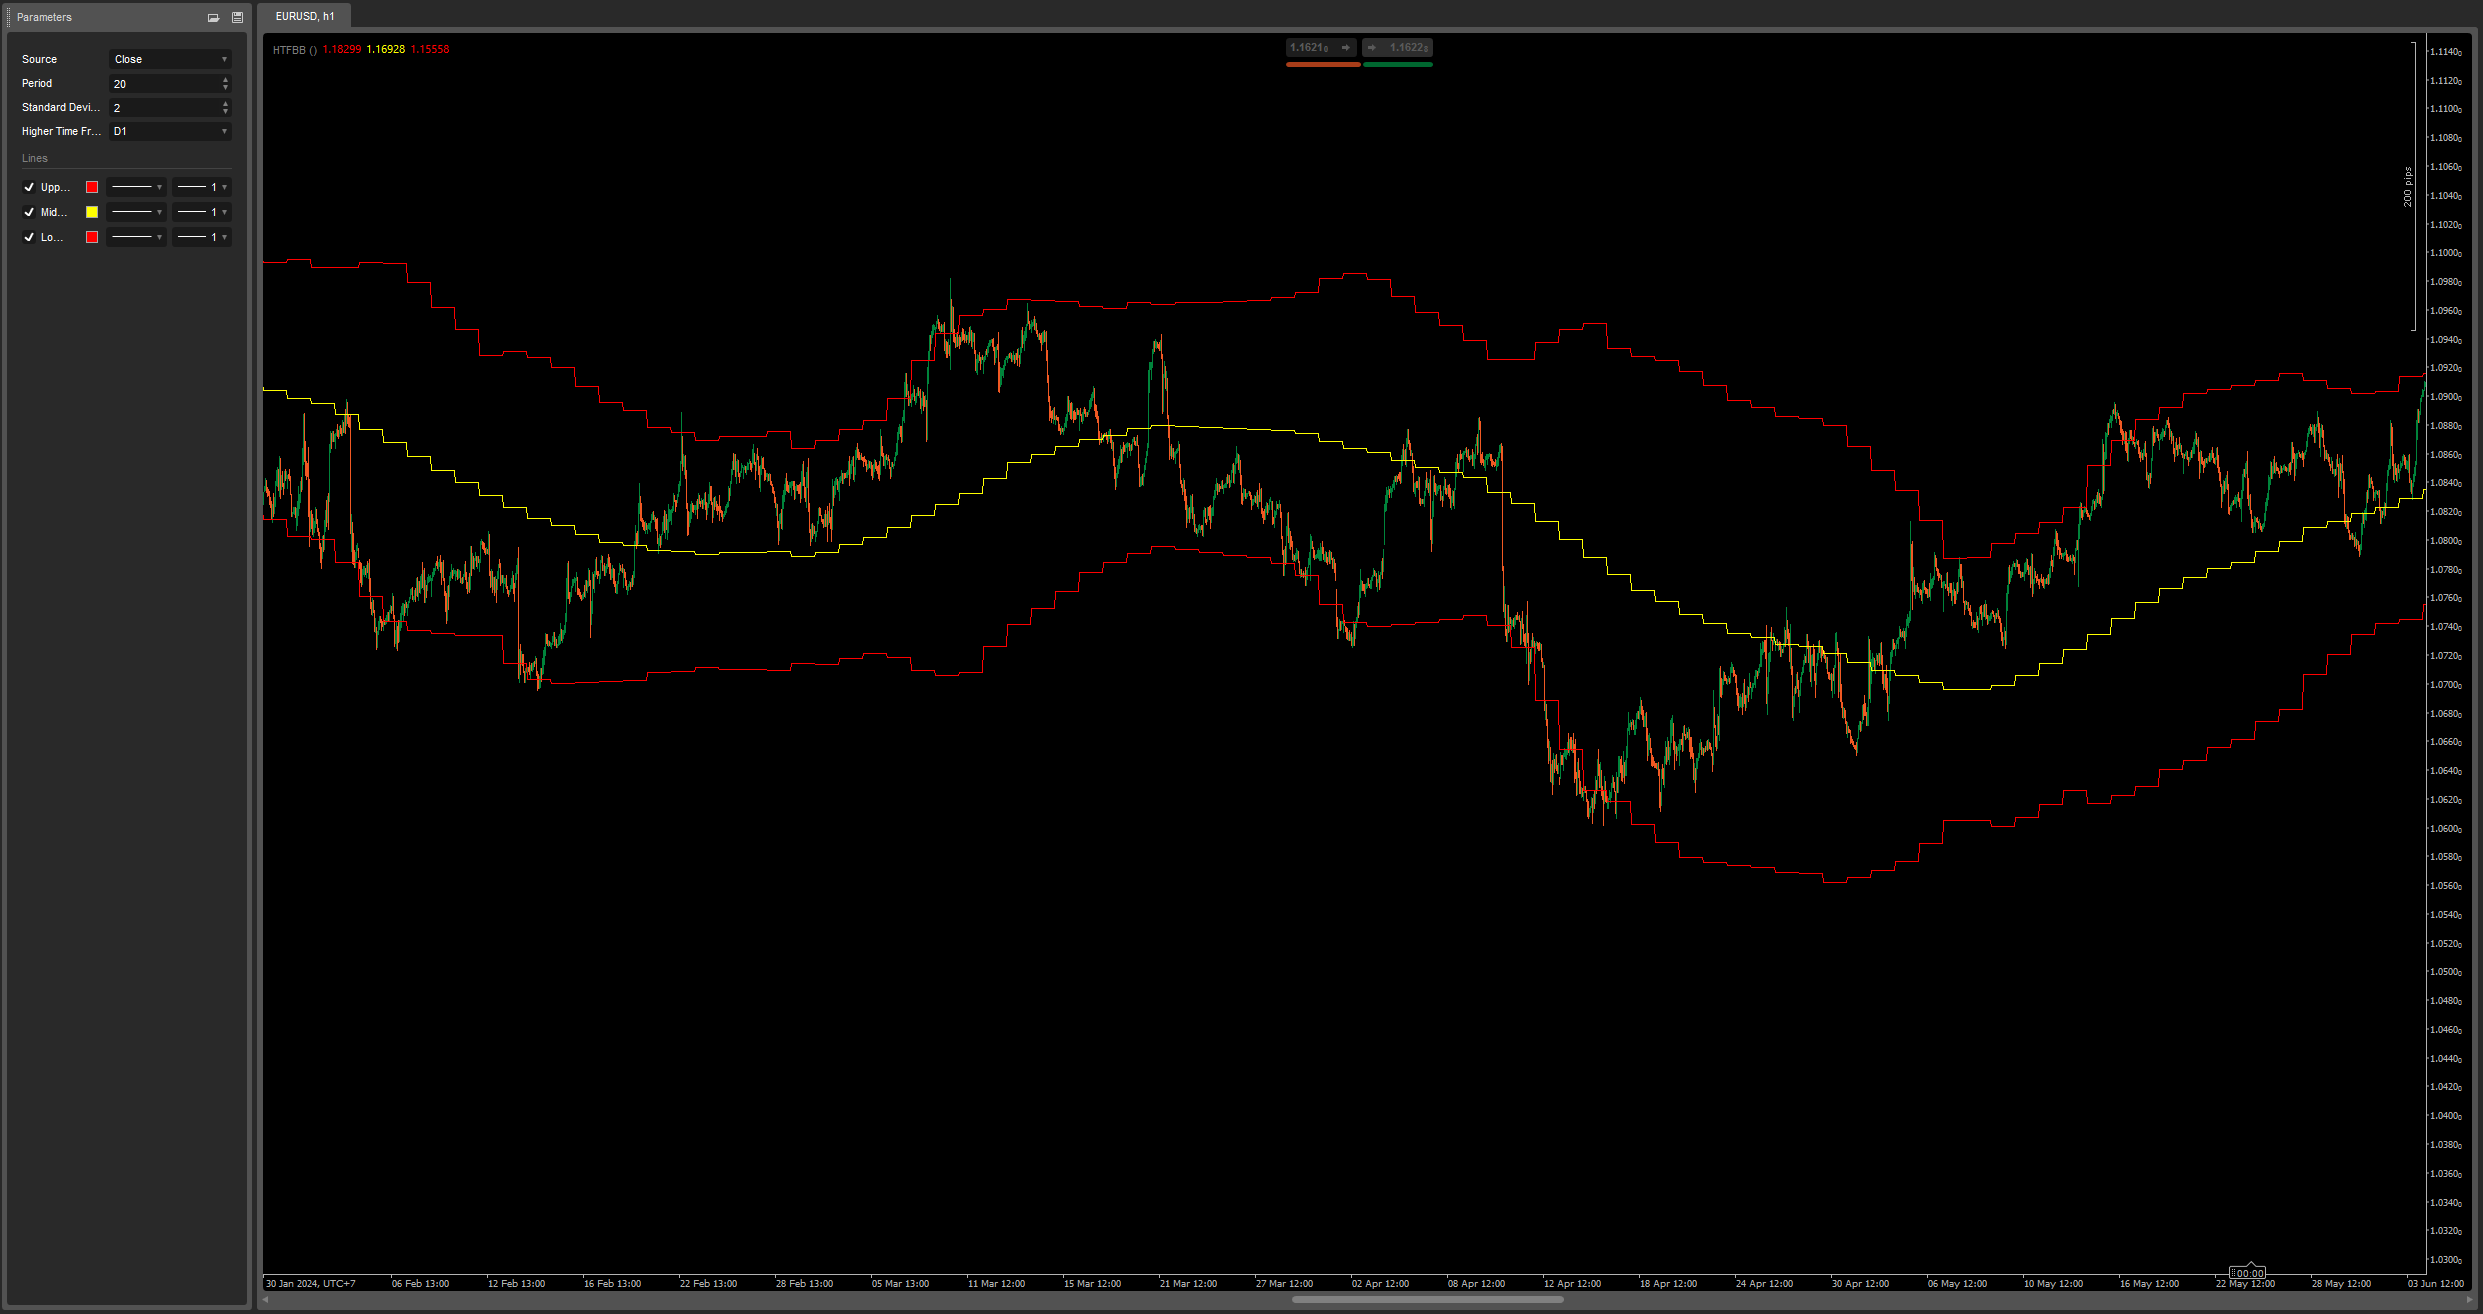
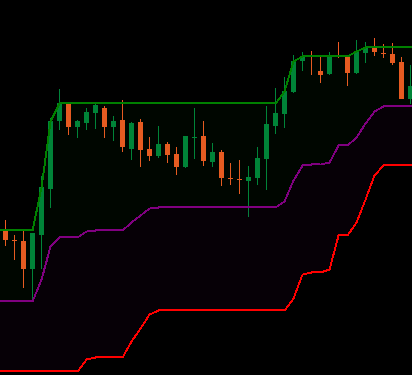
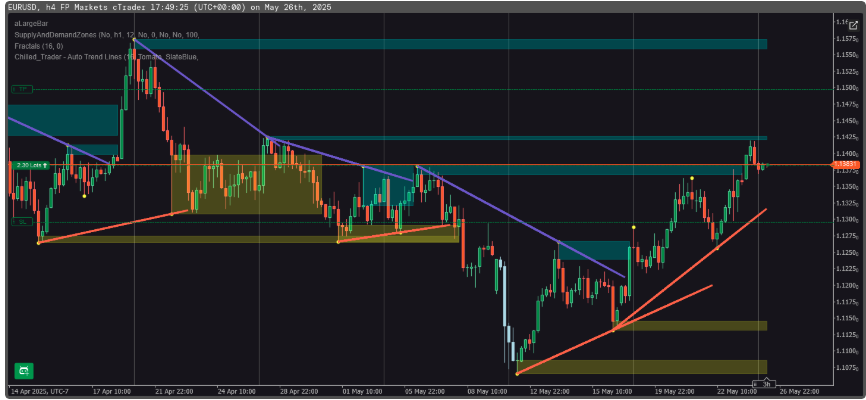
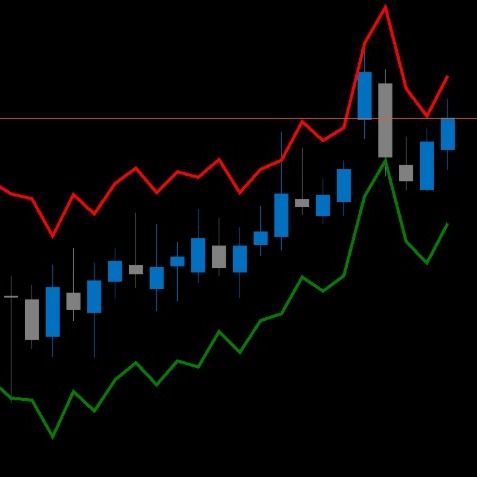
HTF Bollinger Bands – Multi-Timeframe Volatility Map
This indicator plots Bollinger Bands from a higher timeframe onto your current chart, giving you powerful context for volatility, mean reversion, and dynamic support/resistance—all without switching timeframes.
Features:
- Displays upper, middle, and lower Bollinger Bands from any selectable higher timeframe
- Great for spotting HTF consolidation zones, breakout pressure, and trend pullbacks
- Ideal for scalping and intraday entries with higher timeframe awareness
- Works on all assets and timeframes
Combine with your current strategy to avoid trading into volatility traps and stay aligned with macro price structure.
More from this author
You may also like
Indicator
forex
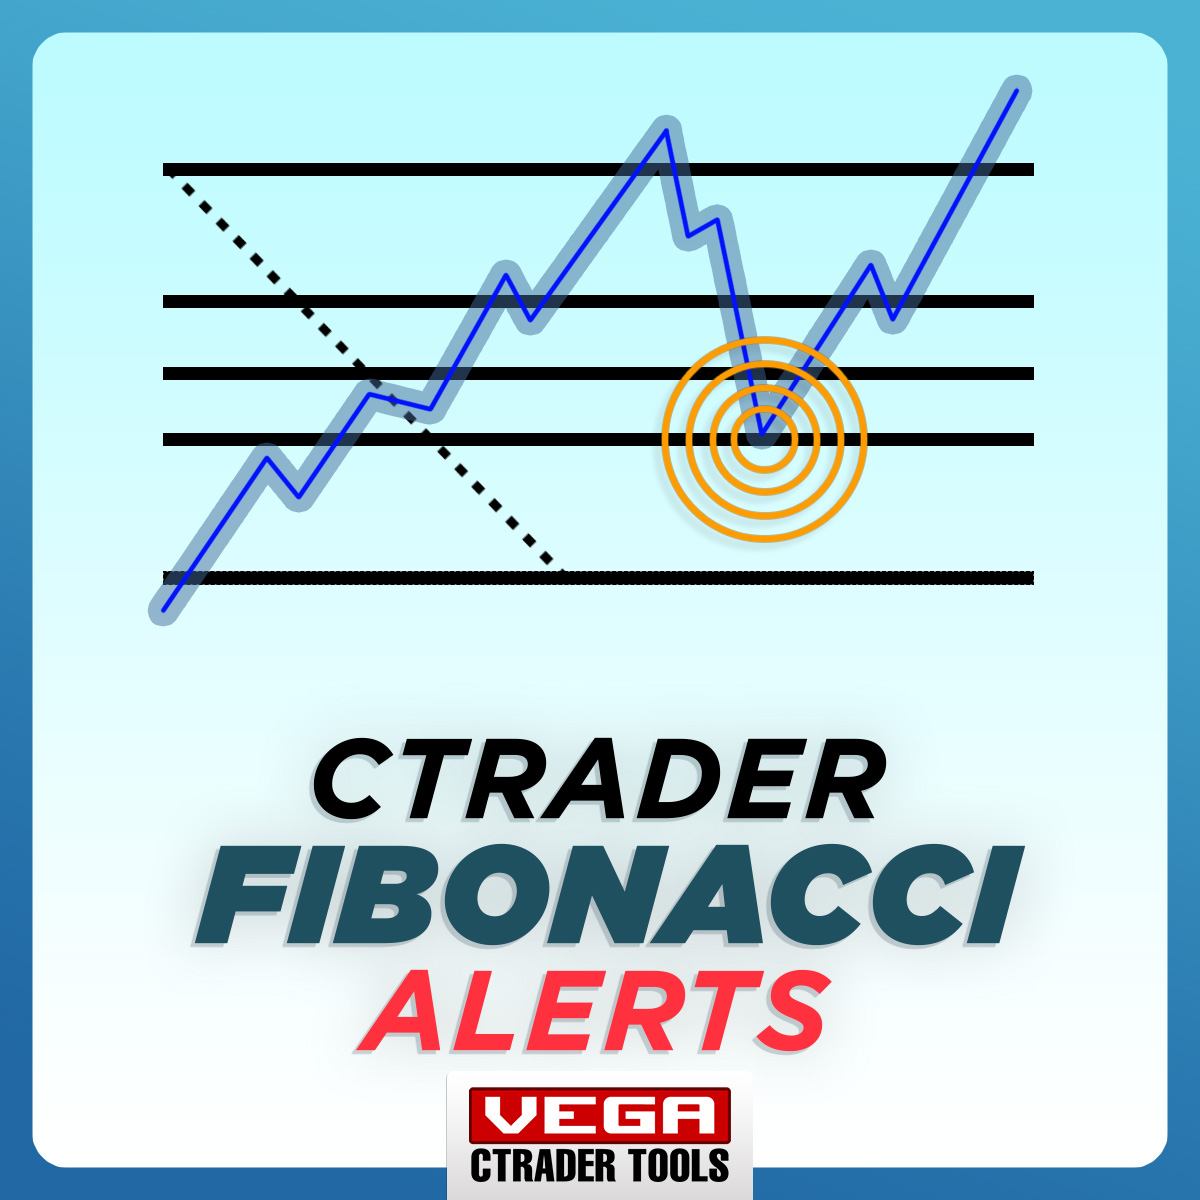
VegaXLR - Fibonacci Alerts
Alerts you when price touches Fibonacci levels. Stay organized and trade efficiently!
Indicator
breakout
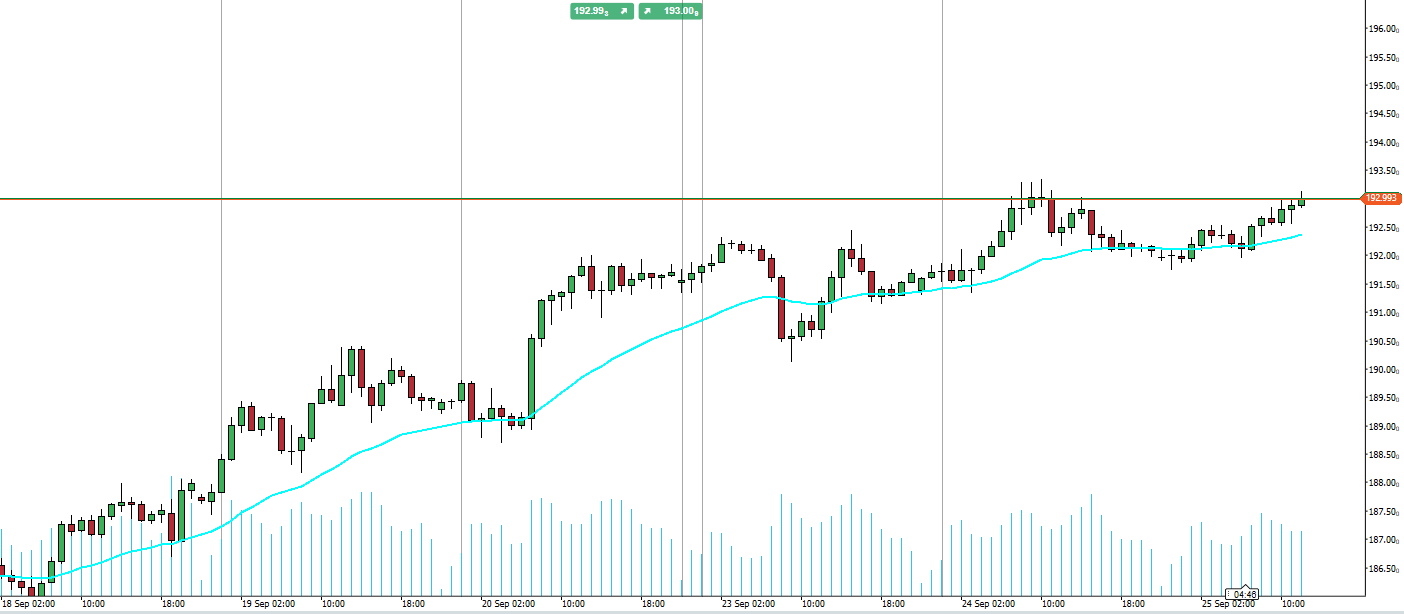
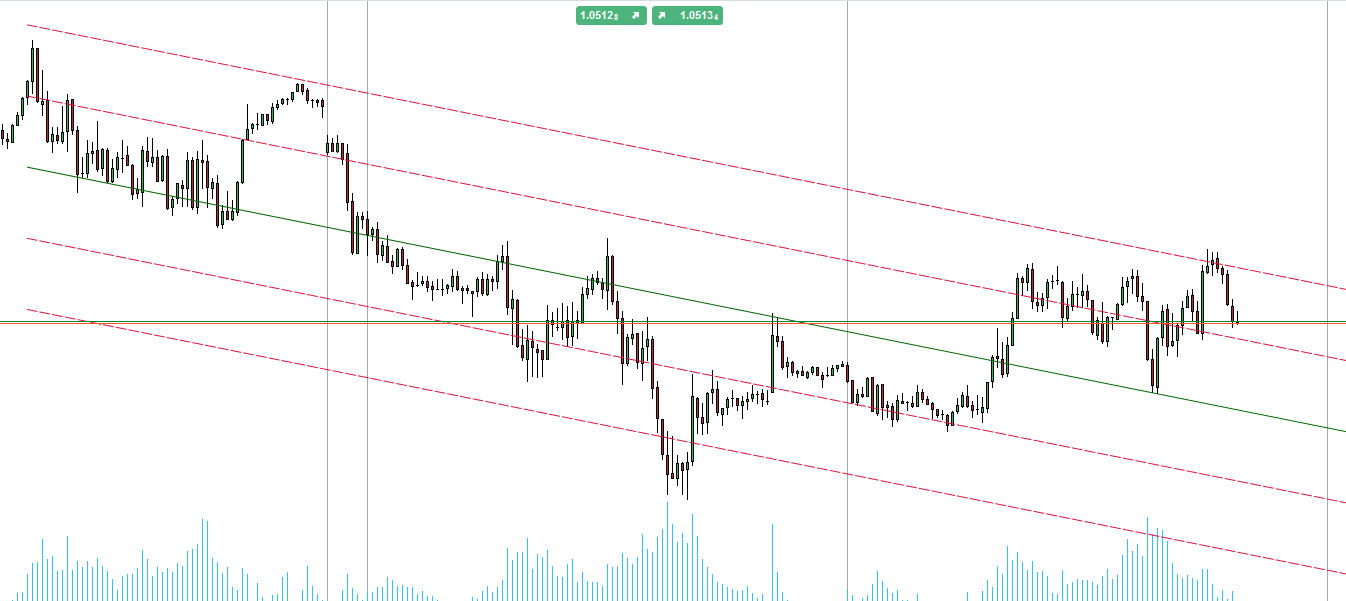
RT Standard Deviation Channel_noSourceCode
Visualize trends with Standard Deviation Channel! Display median, and add customizable upper/lower deviation channels.
.jpg)