Weekly Daily Levels
19/08/2025
1
Desktop
Since 19/04/2025
Sales
1
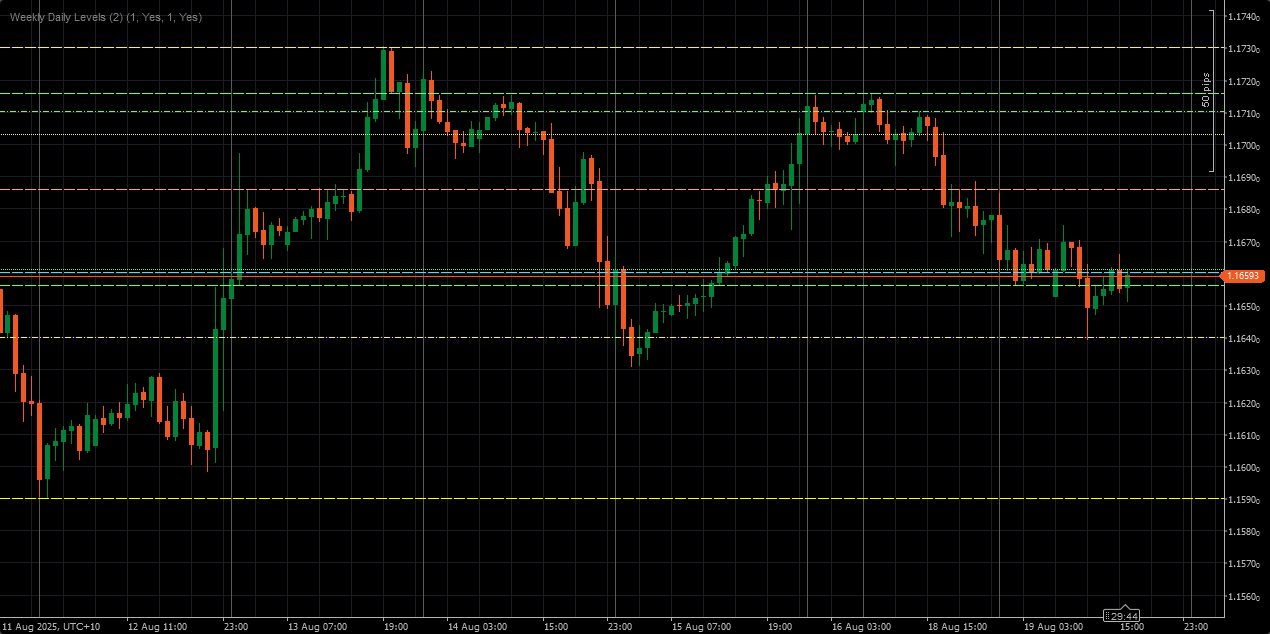
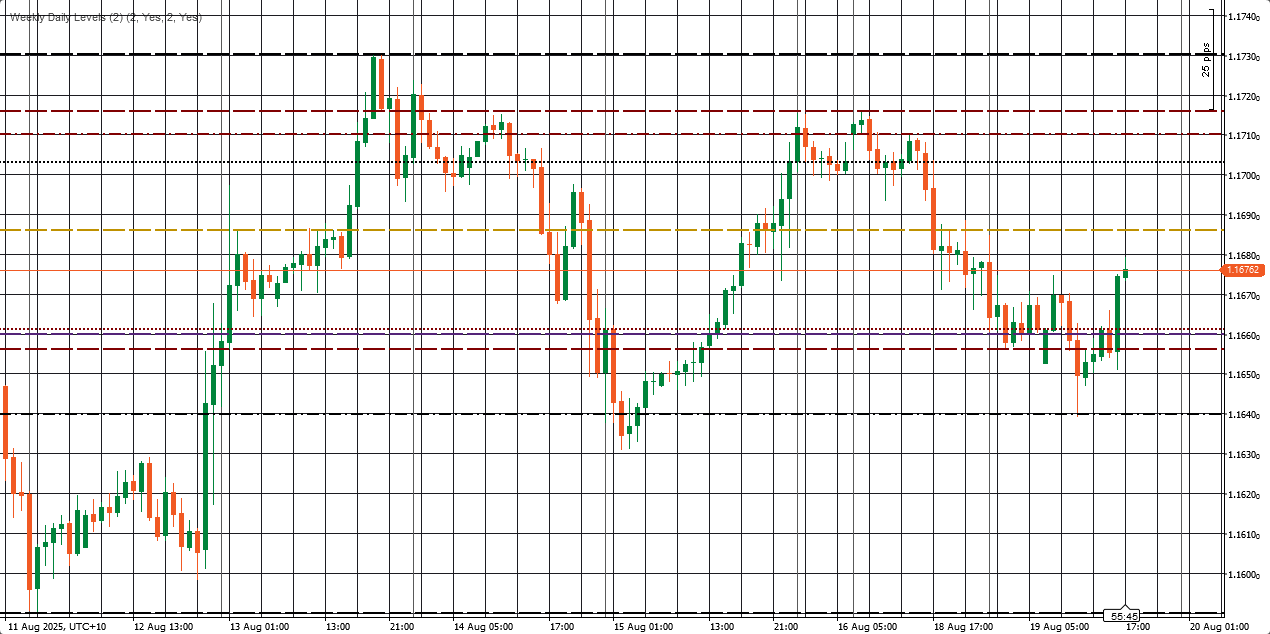
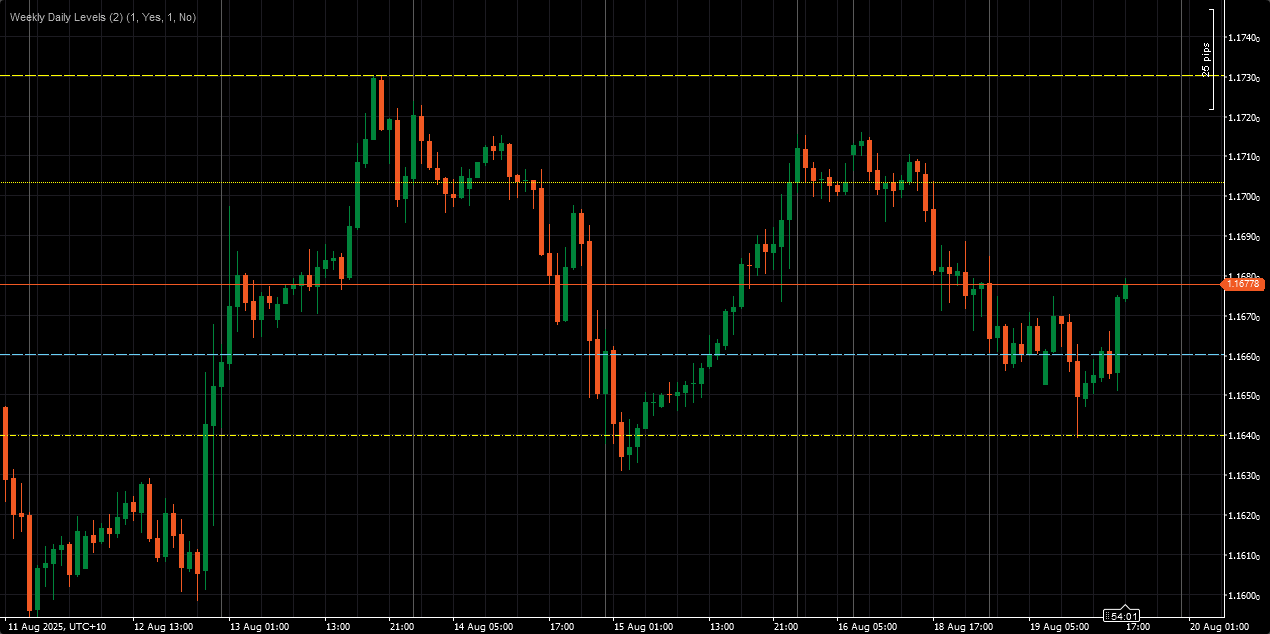
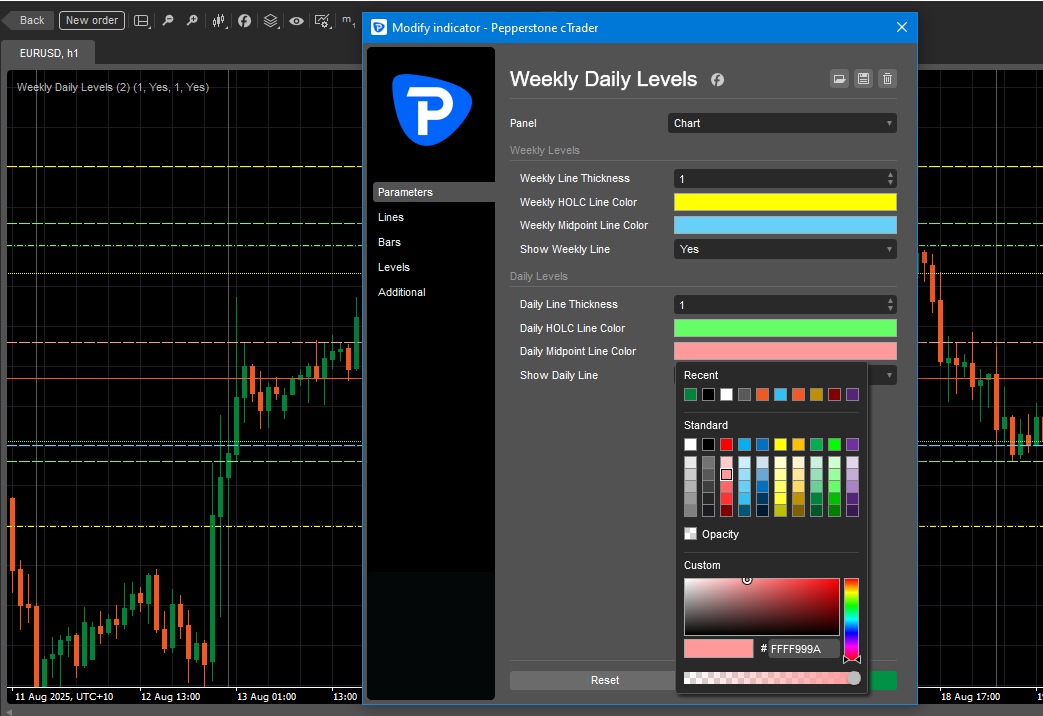
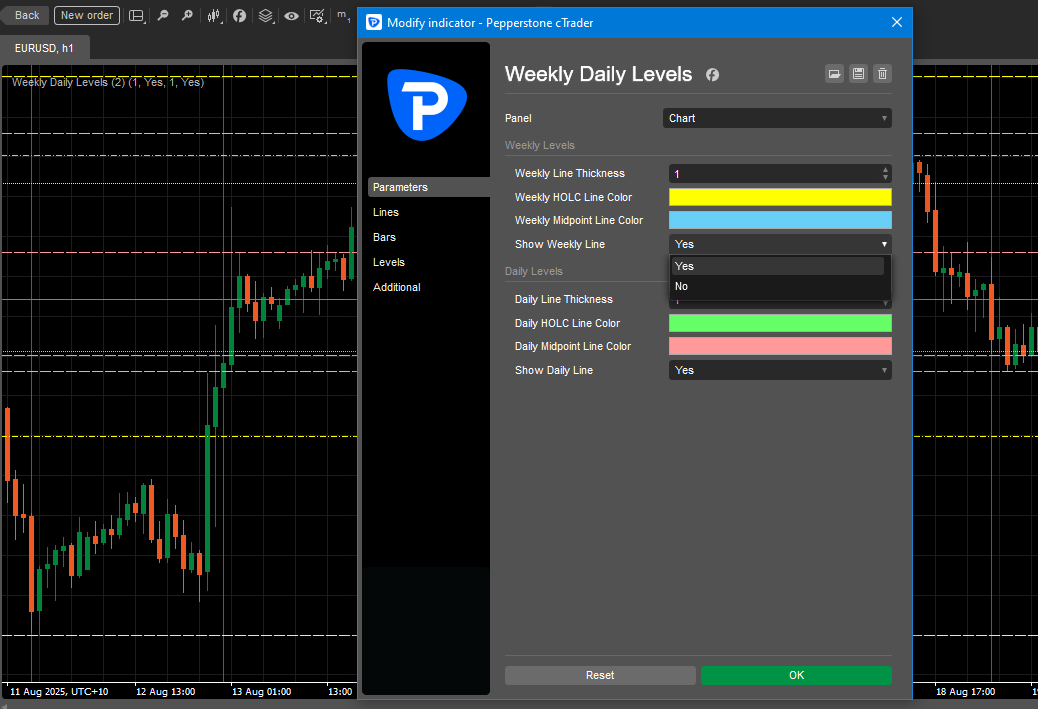
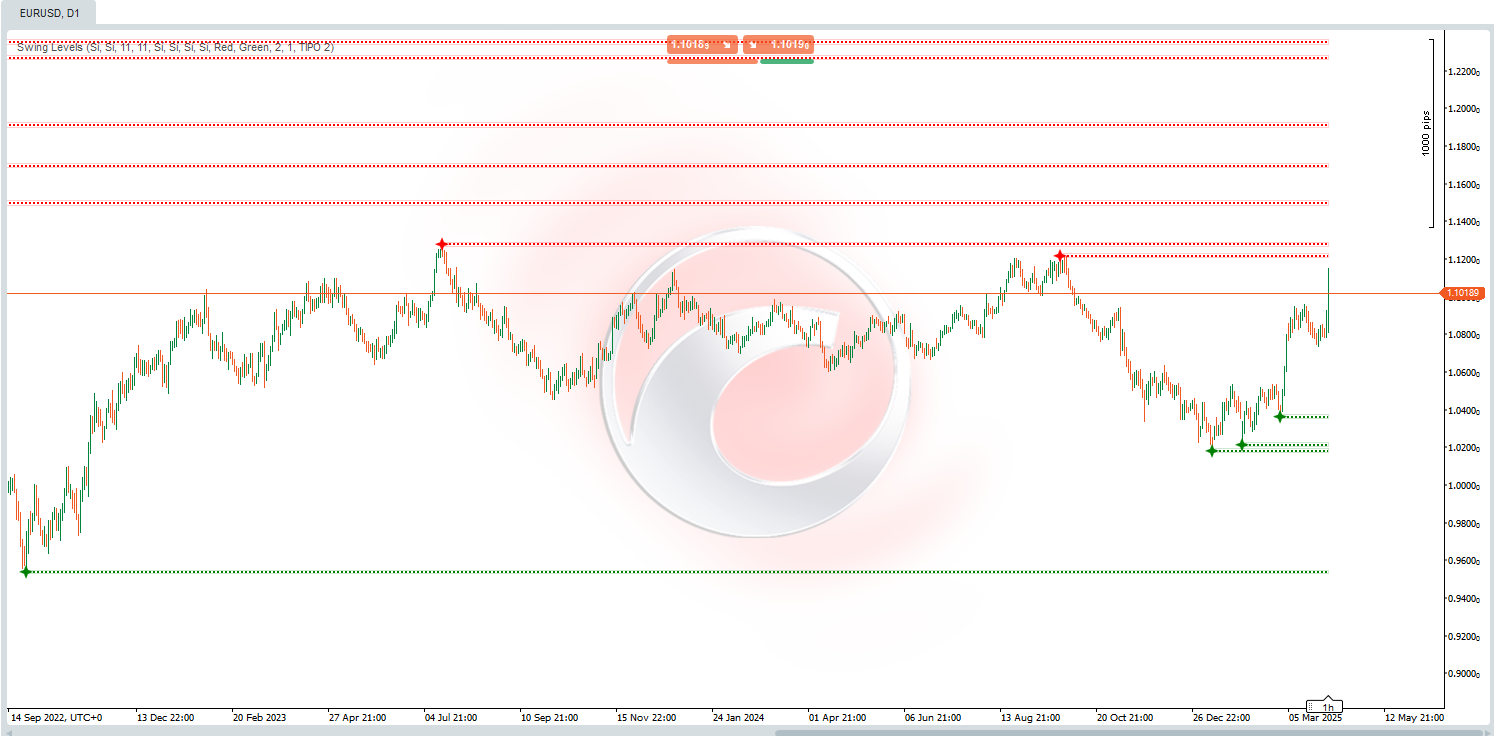
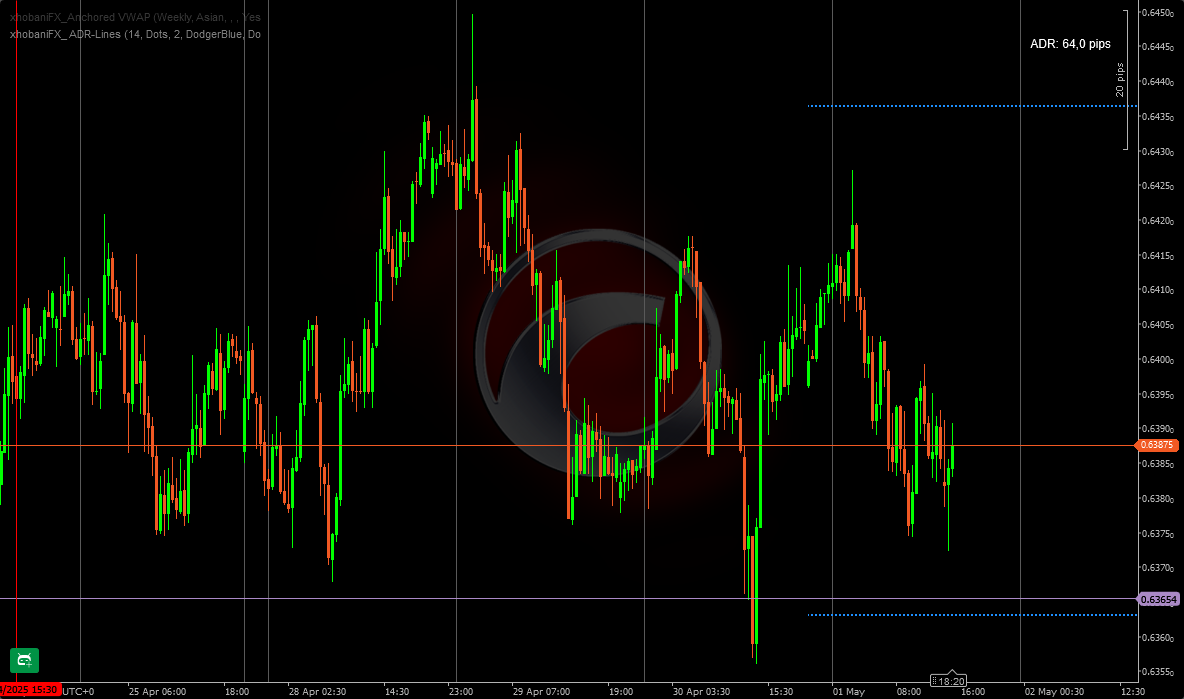
Are you relying on daily and weekly OHLC and mid-point prices in your trading strategy? Tired of marking them manually every time you take a trade?
The Weekly Daily Levels Indicator does the heavy lifting for you. It automatically plots the previous day’s and previous week’s open, high, low, close (OHLC), and mid-point prices directly on your chart. This means you can concentrate on executing your strategy while the indicator takes care of the details—making your trading simpler, faster, and far more efficient.
Key Features:
- Instantly displays daily and weekly OHLC and mid-point prices.
- Customize line colors to match your chart style.
- Turn daily or weekly levels on or off with a single click.
- Adjust line thickness for better visibility.
You may also like
Indicator
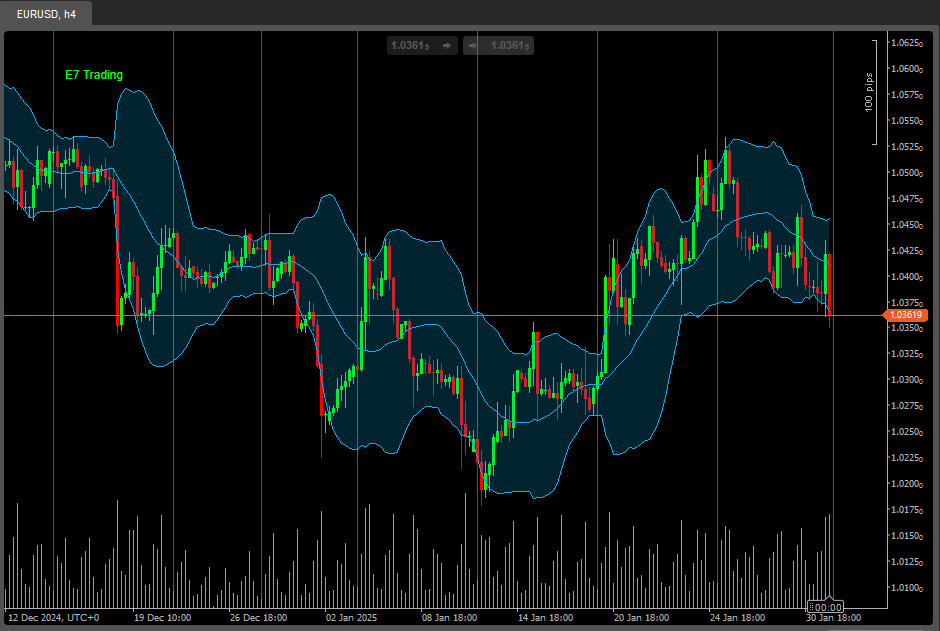
Bollinger
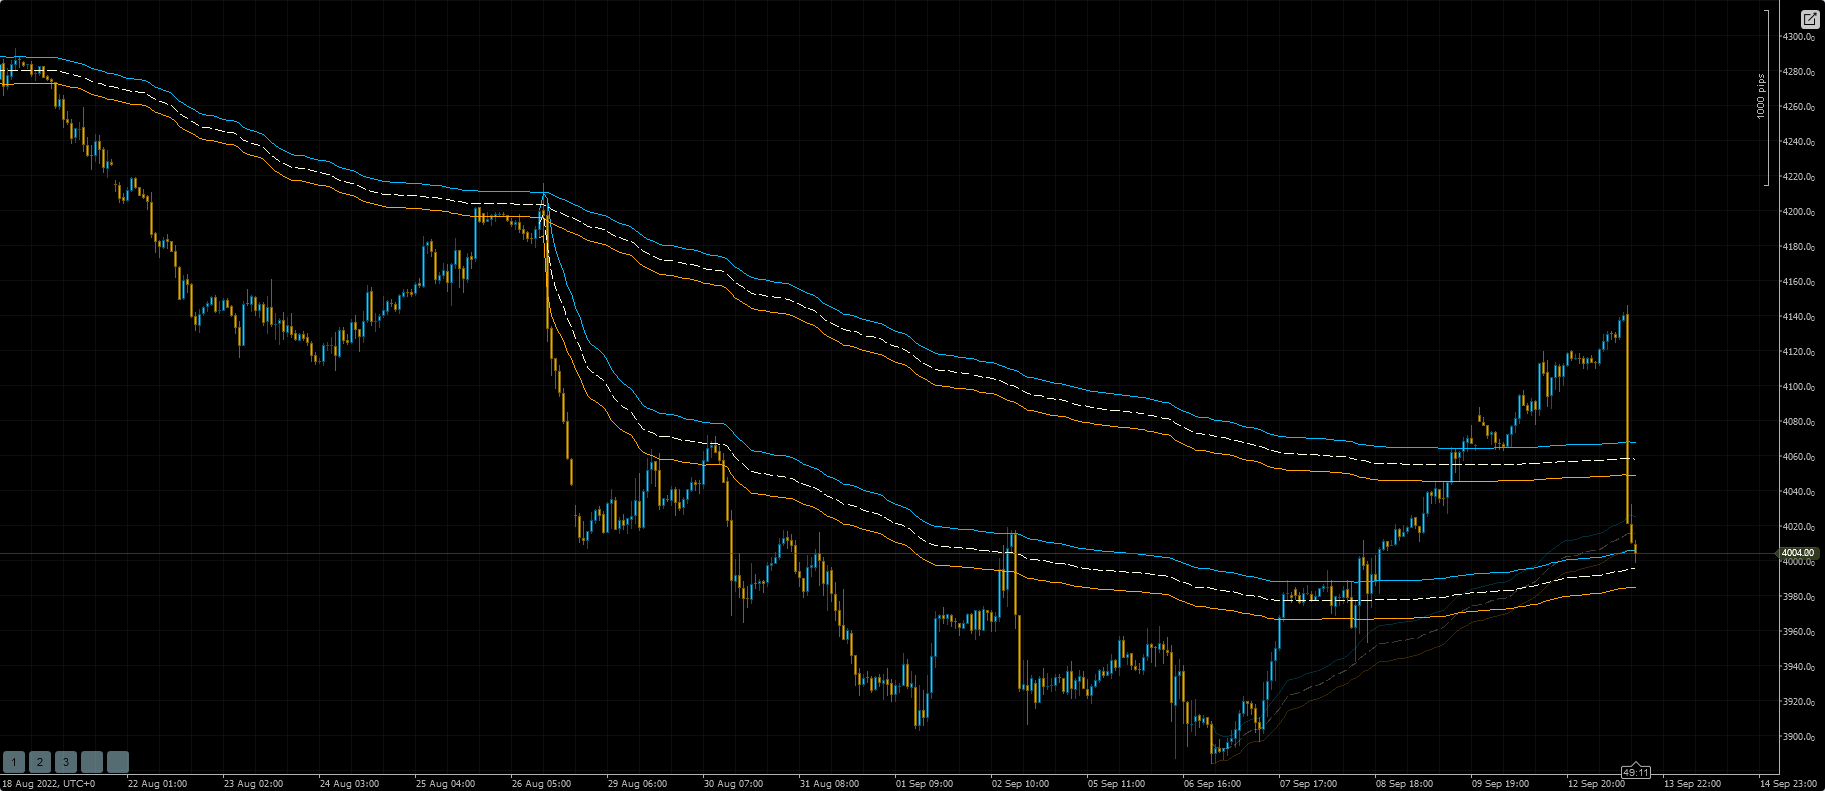
E7 Indicators Free Overlays
Bollinger Band Cloud, Heiken Ashi, Trend Follower and Parabolic SAR.

Indicator
Breakout
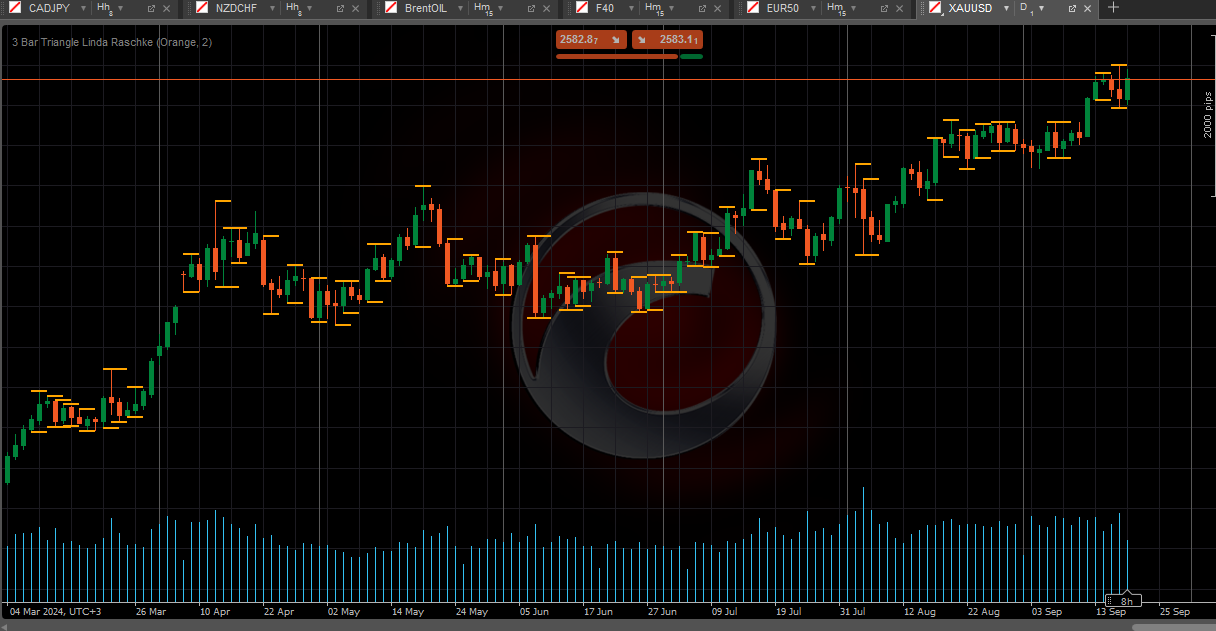
3 Bar Triangle by Linda Raschke
3 bar triangle = high below 2 day high, low above 2 day low

Indicator
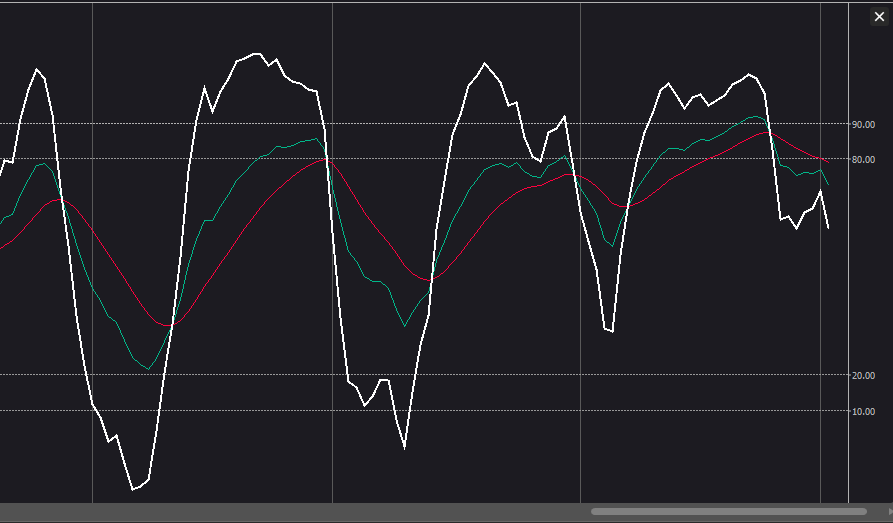
RSI
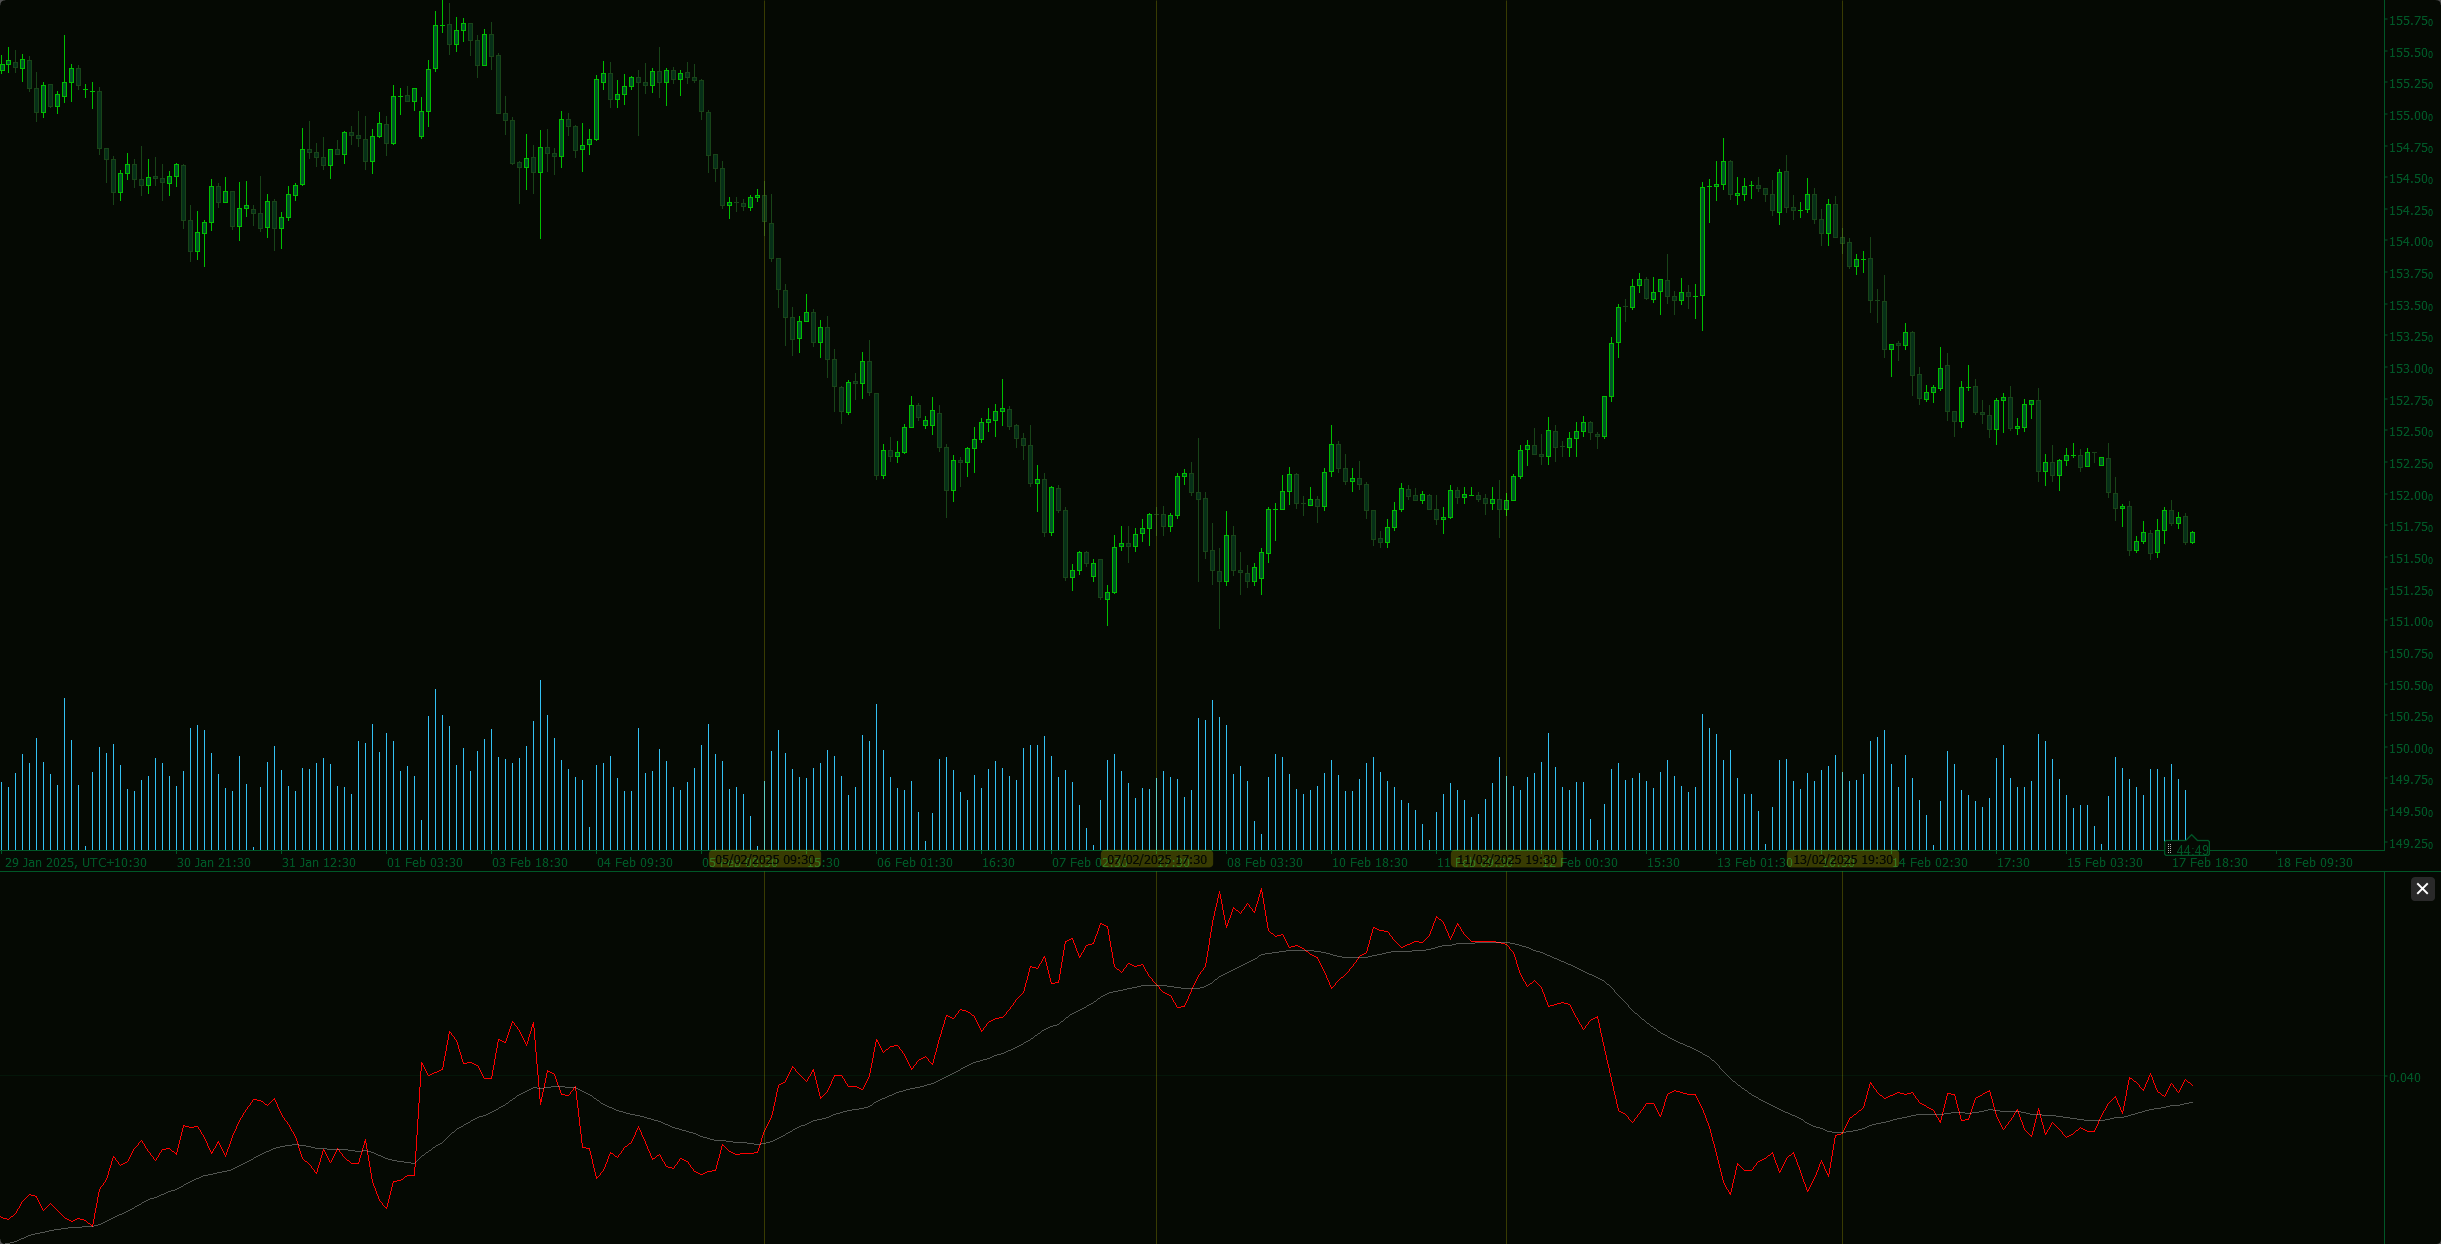
SuperEmaColorRSI
This is a super indicator that integrates the RSI indicator with a dual moving average system.