Market Entropy
30/08/2025
25
Desktop
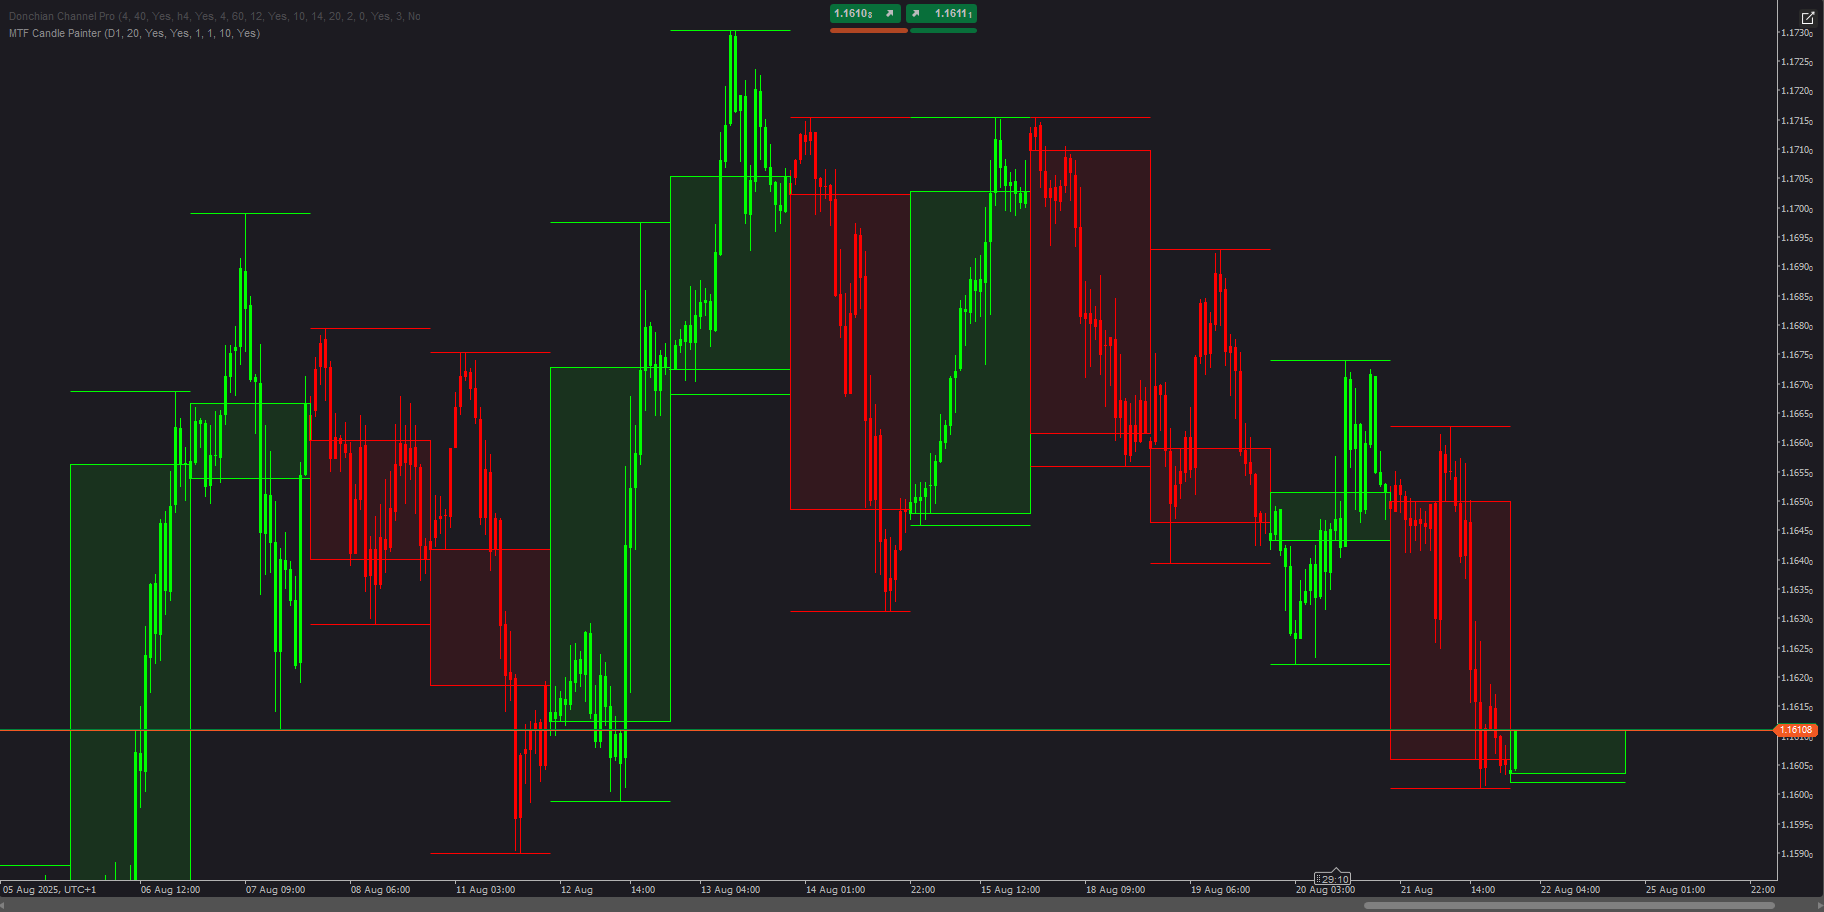
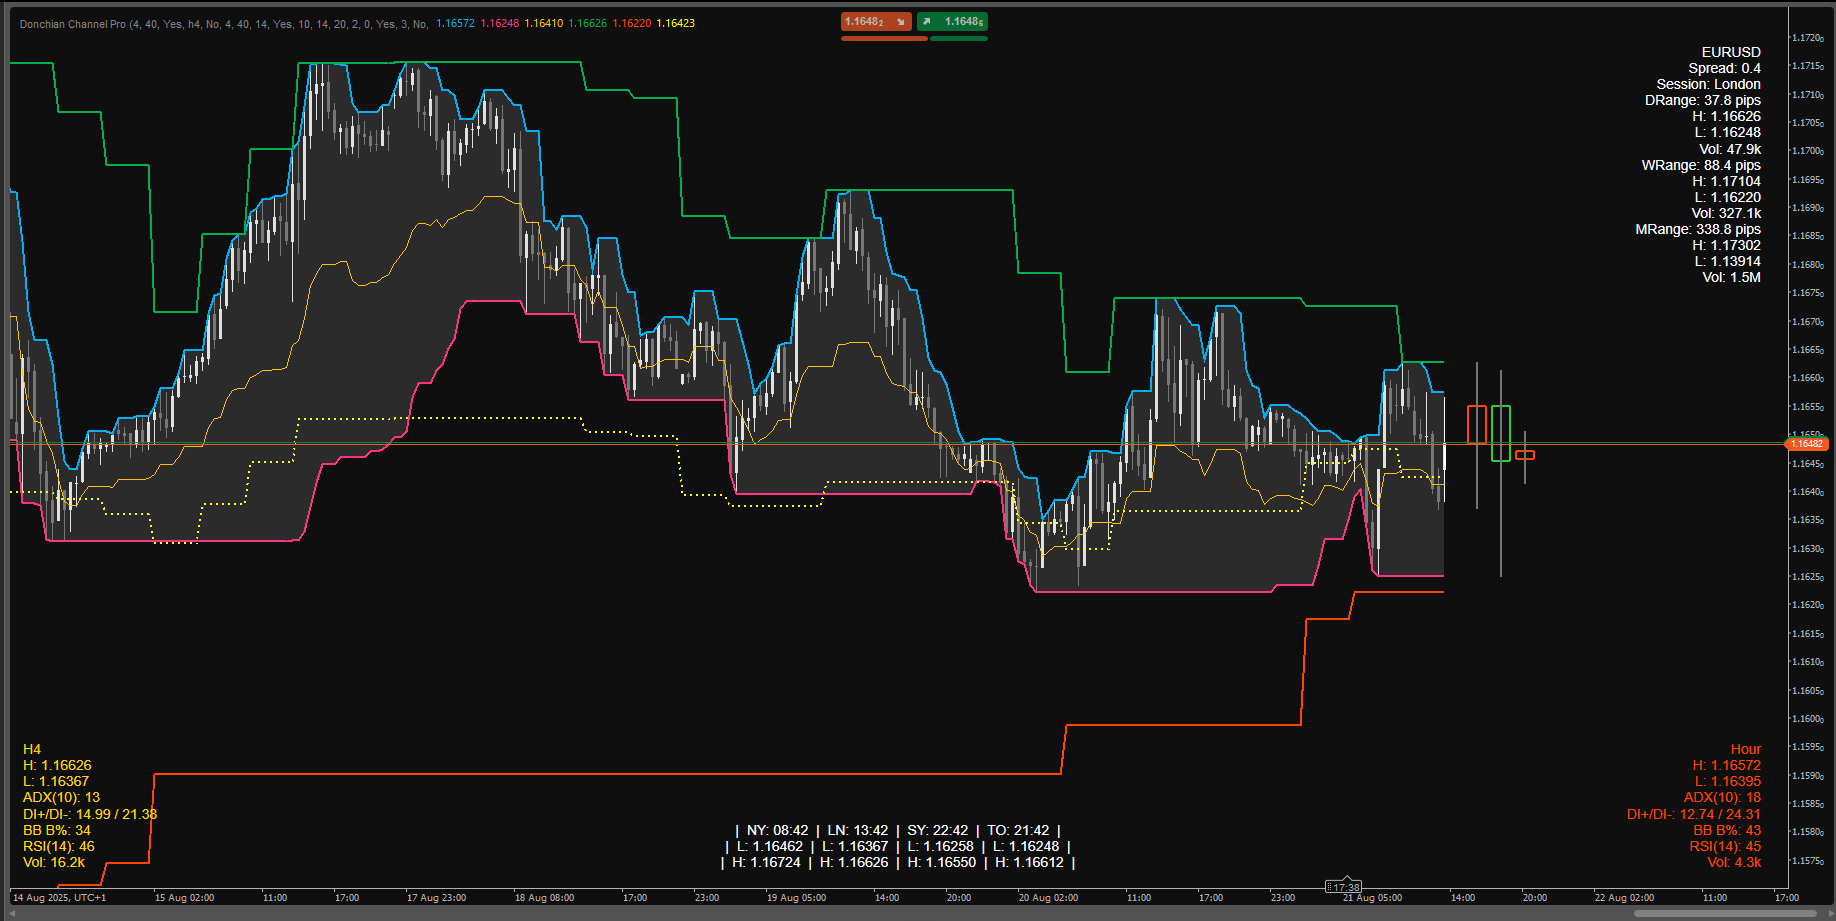
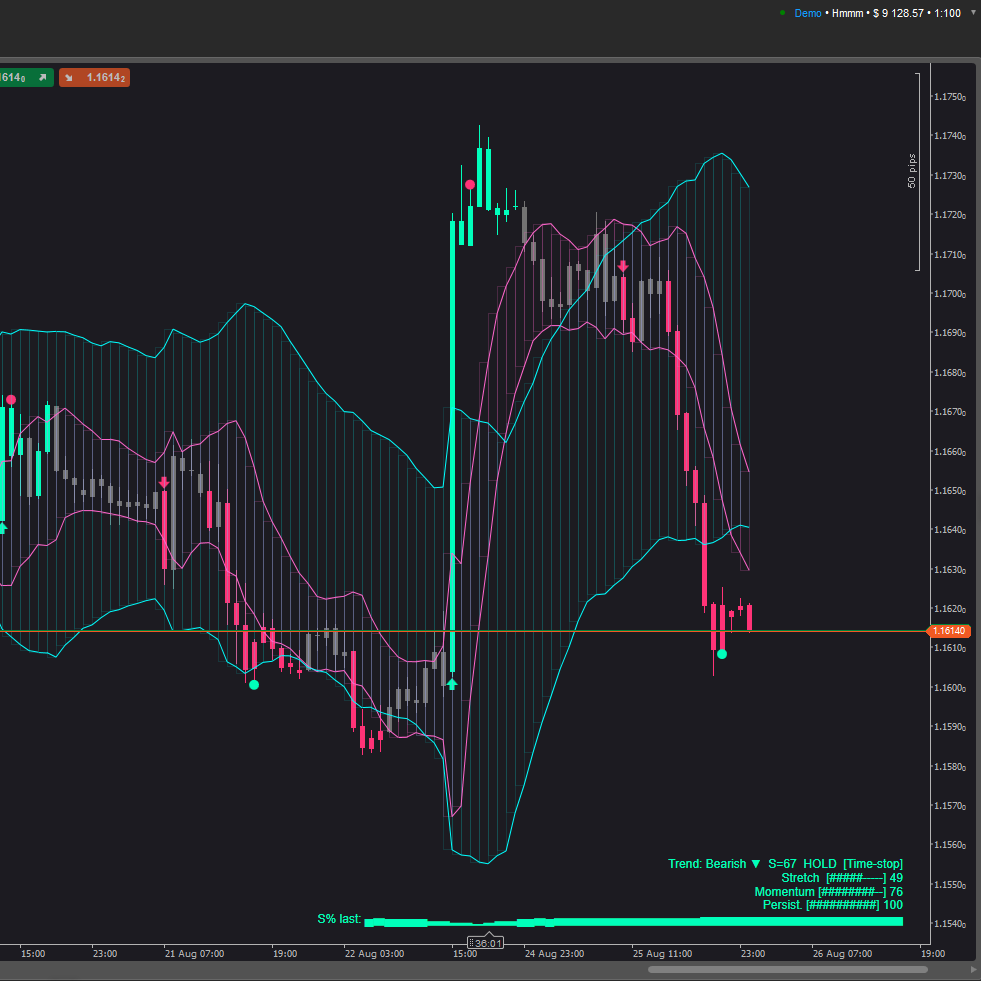
Market Entropy is a dual indicator (oscillator + optional price overlay) that quantifies market organization and flags regime shifts across Order → Transition → Chaos. It adds a second line, Trendness (DC), to separate true trend from volatility squeeze.
How it works:
- Uses only OHLCV components: DC (directional consistency), FlipRate (sign flips), Volatility_n (ATR/ATRlong), VolumeTurb (stddev of ΔVolume).
- Raw entropy:
E0 = 0.5*(1-DC) + 0.3*(FlipRate*VolN) + 0.2*VolumeTurb). - Anti-squeeze term lowers E during ATR compressions → final Entropy ∈ [0..1] with EMA smoothing.
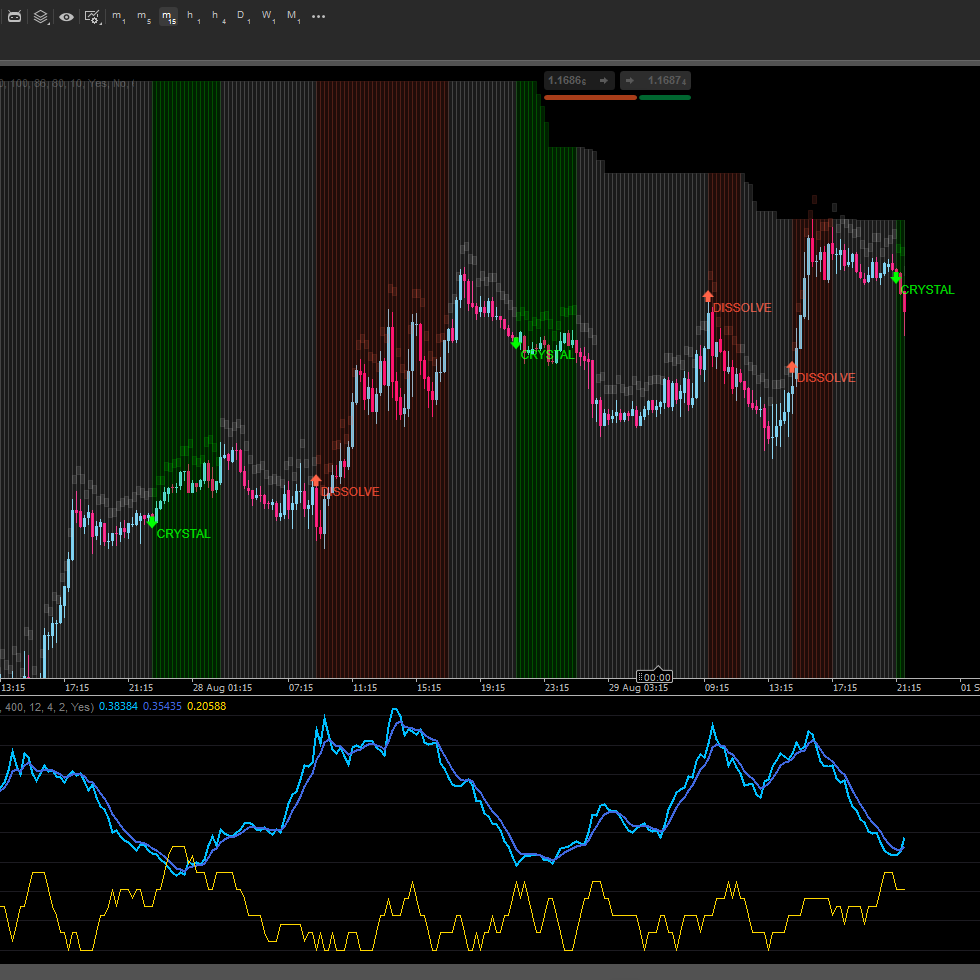
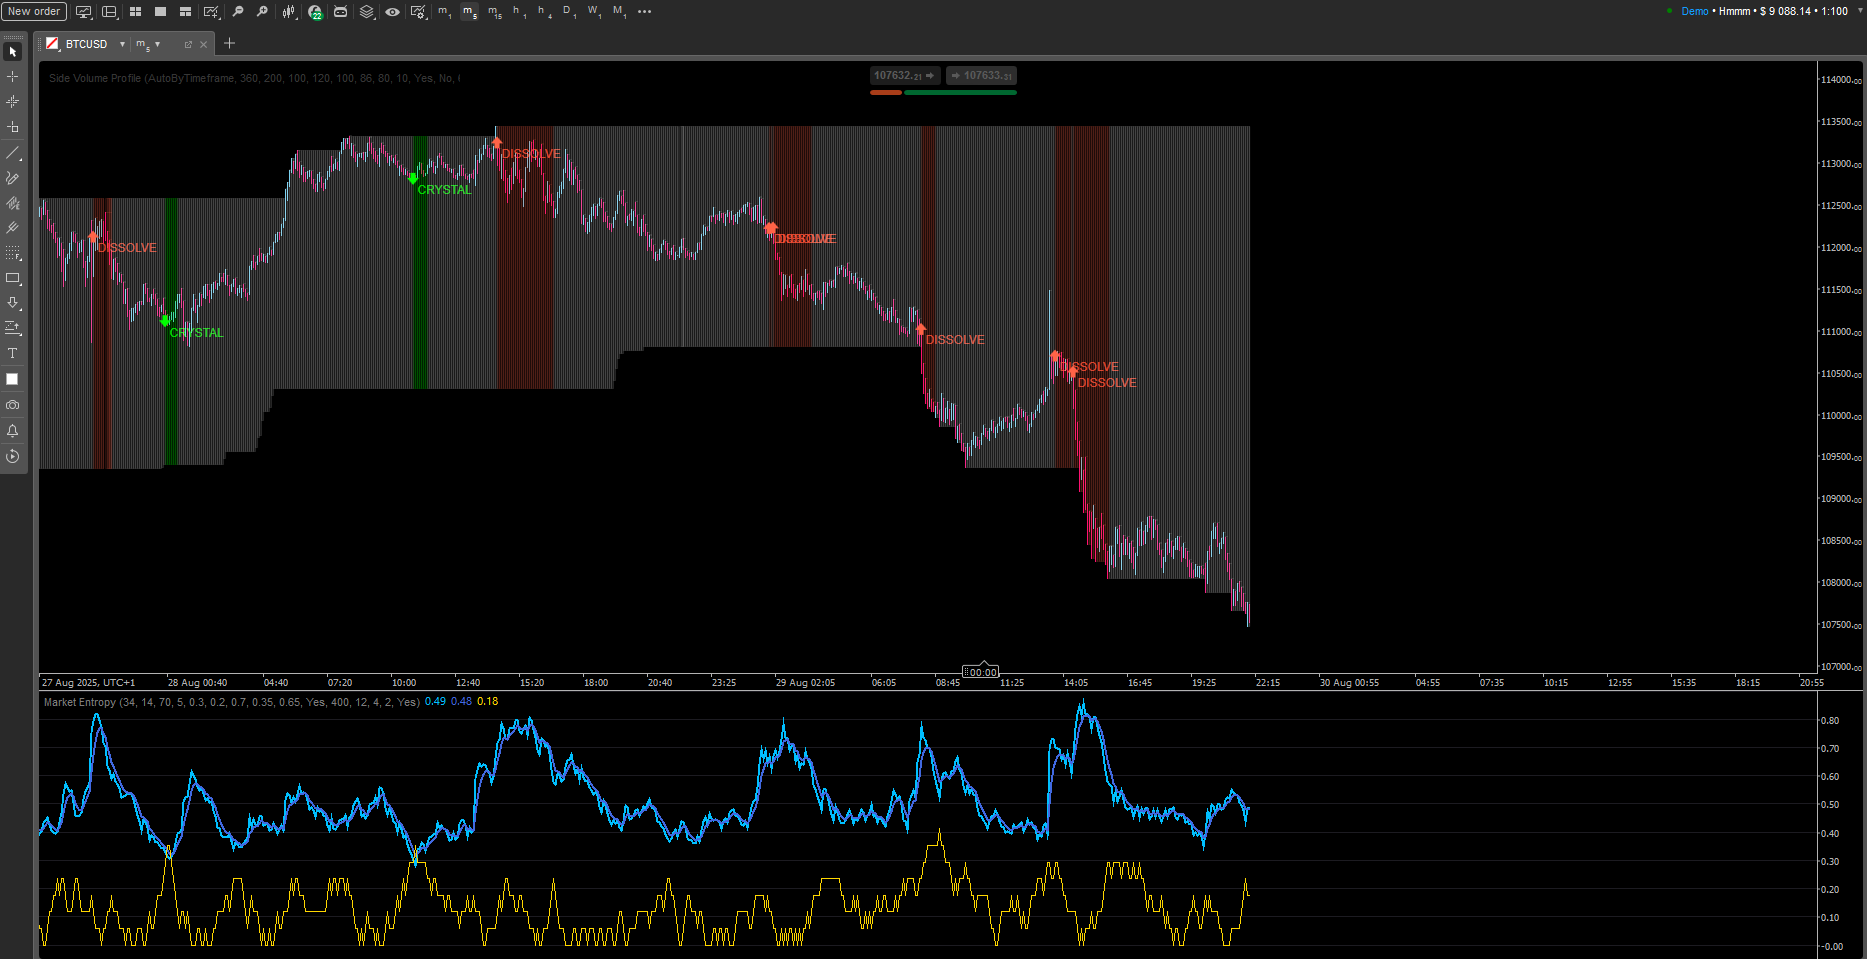
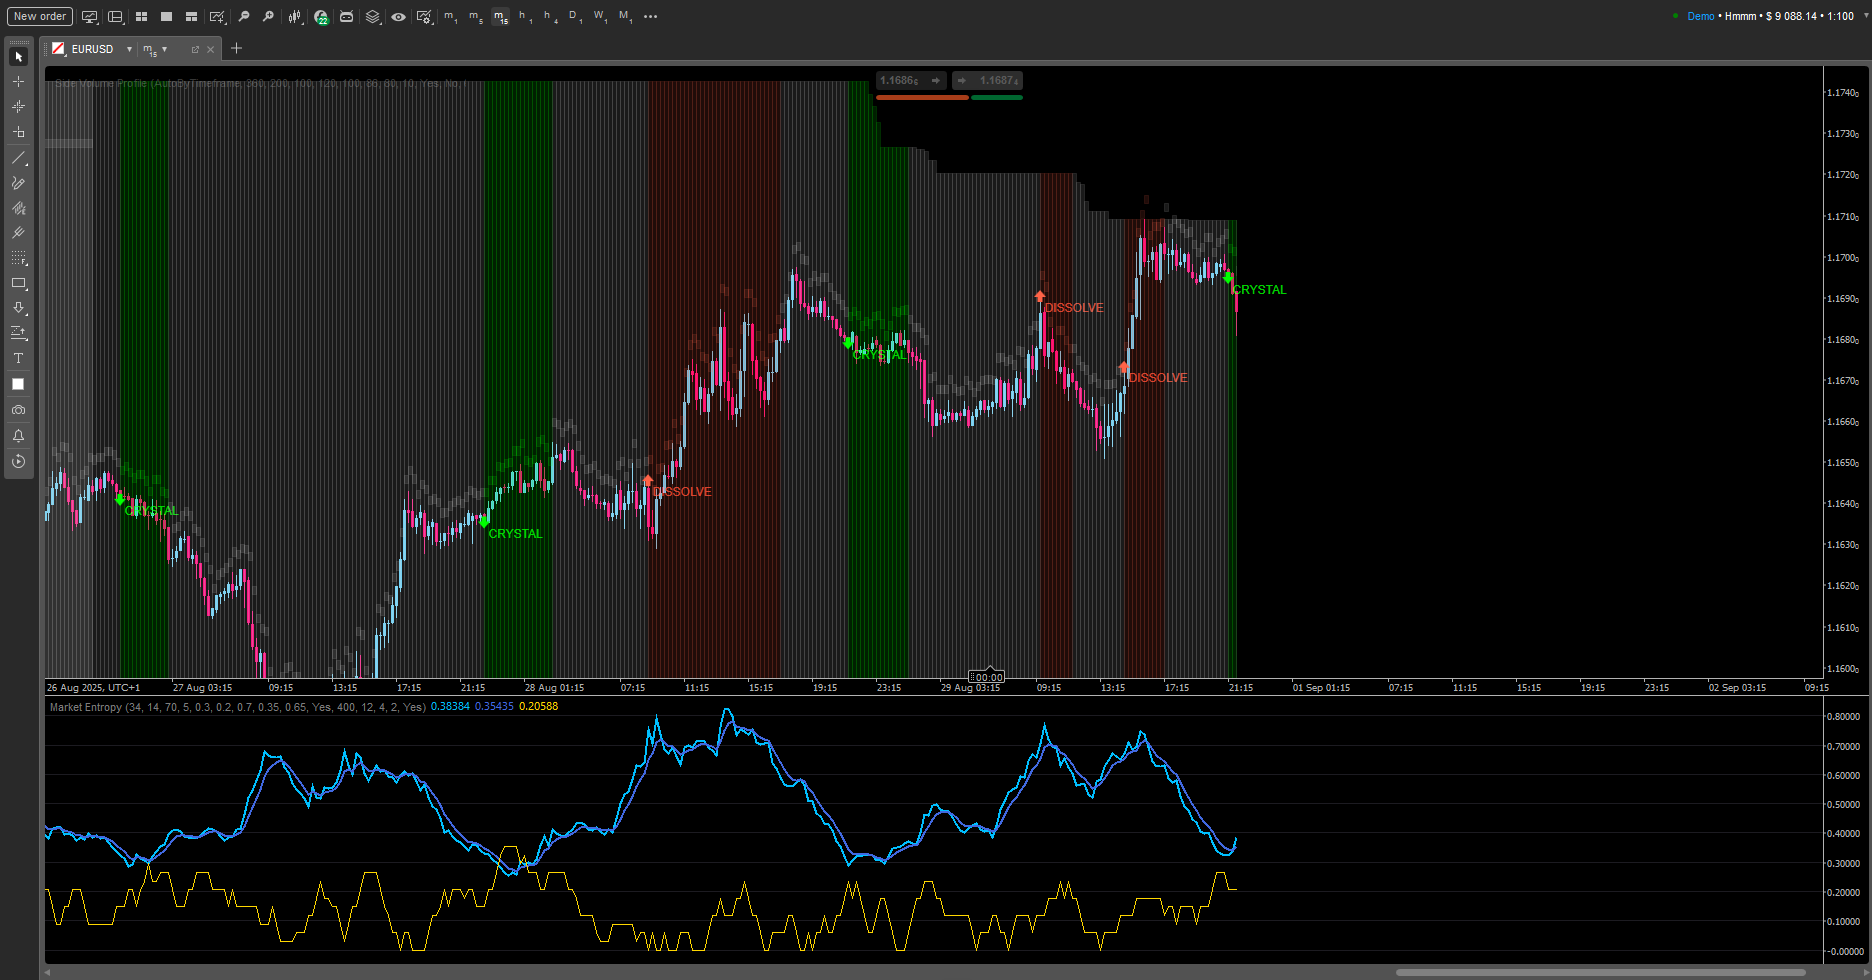
- Markers:
- CRYSTAL — cross below LowThr (order emerges: trend or pre-break squeeze).
- DISSOLVE — cross above HighThr (order breaks: chaos/trend decay).
What you see:
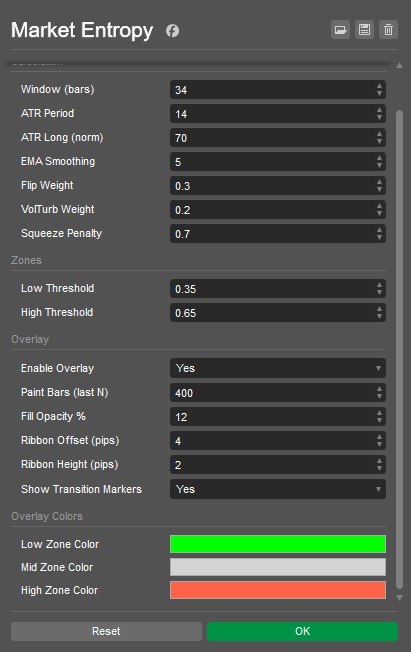
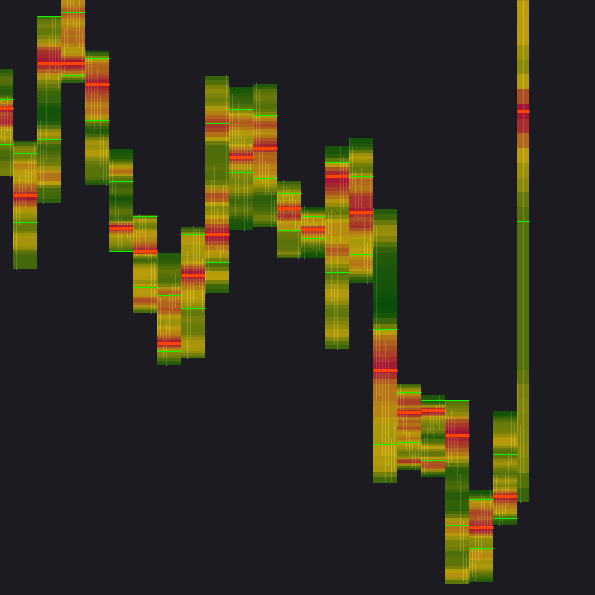
- In the panel: Entropy, Entropy(EMA), Trendness (DC), Low/High thresholds, zone background.
- On chart (toggleable): state-colored bars, a slim ribbon above highs, and CRYSTAL/DISSOLVE markers.
Reading guide:
- E < LowThr → Order:
- with high DC → organized trend;
- with low ATR → squeeze (expect break).
- LowThr…HighThr → Transition: structure forming; wait for resolution.
- E > HighThr → Chaos: uncertainty / trend wear-off; avoid naive continuation entries.
Playbooks:
- Squeeze → CRYSTAL → Break/Retest — trade the breakout.
- Trend → DISSOLVE — scale out or tighten risk.
0.0
Reviews: 0
Customer reviews
No reviews for this product yet. Already tried it? Be the first to tell others!
More from this author
You may also like

.jpg)
!["[Hamster-Coder] Pivot Points (Demo)" logo](https://market-prod-23f4d22-e289.s3.amazonaws.com/6a1481e2-bd00-4037-bcf0-33495594f95a_Icon300.jpg)
.jpg)
 (1).jpg)