Indicator
forex
bollinger
supertrend
rsi
atr
crypto
grid
scalping
macd
"PFO Price Flow Oscillator" logo
PFO Price Flow Oscillator
0.0
21/09/2025
0
Desktop
"PFO Price Flow Oscillator" uploaded image"PFO Price Flow Oscillator" uploaded image"PFO Price Flow Oscillator" uploaded image

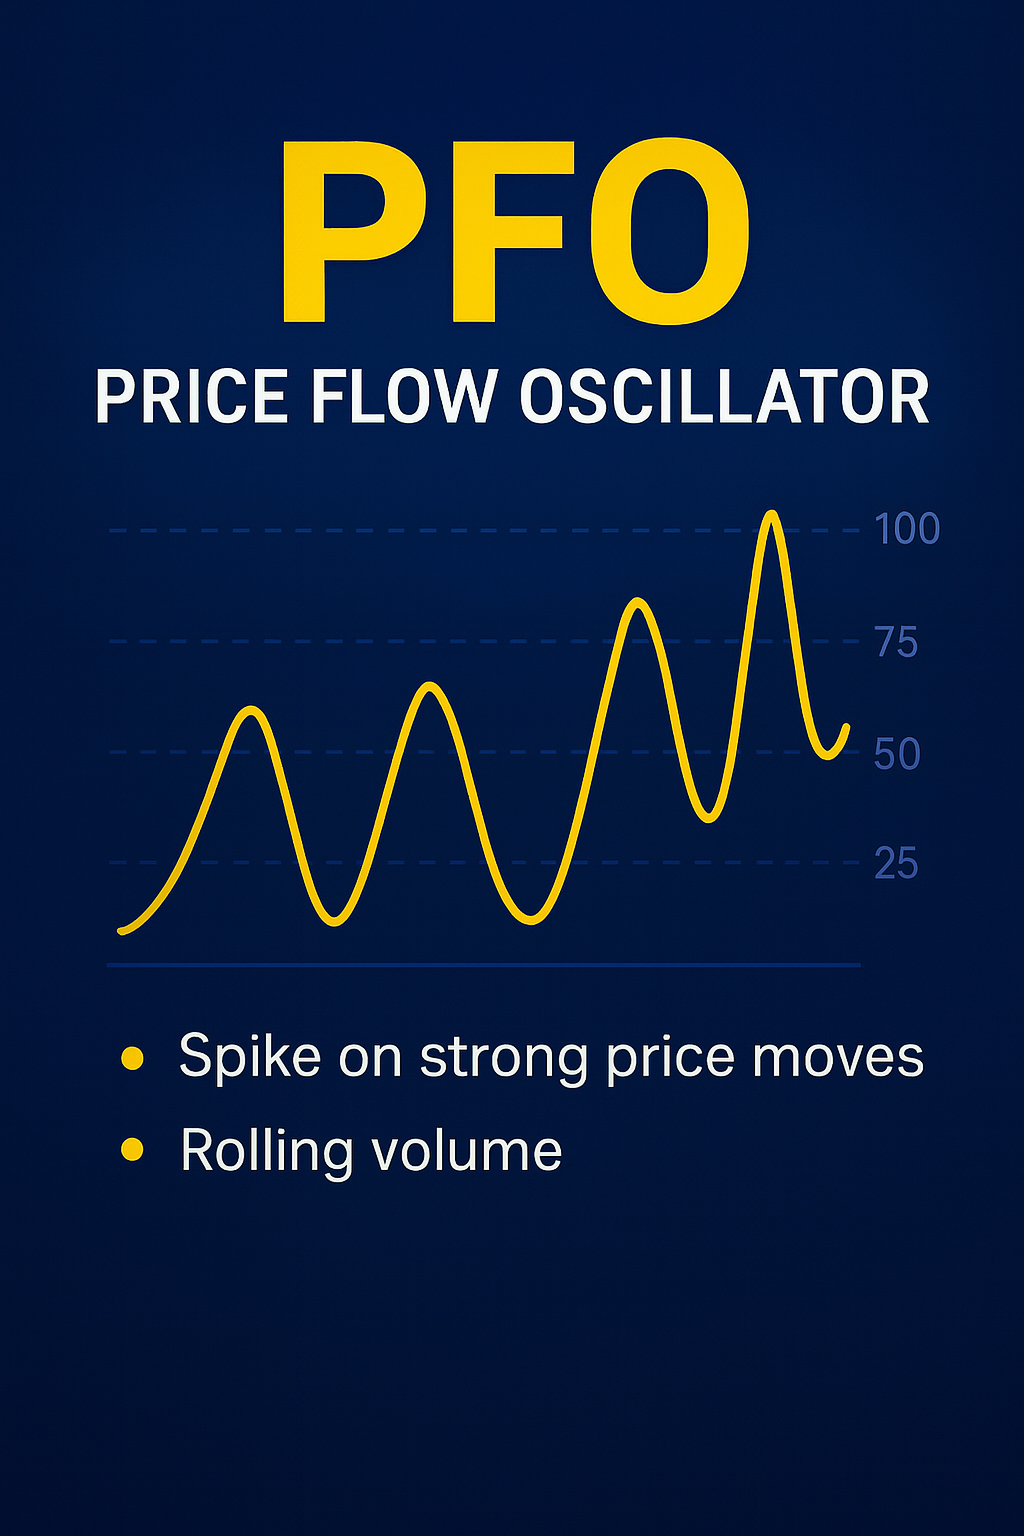
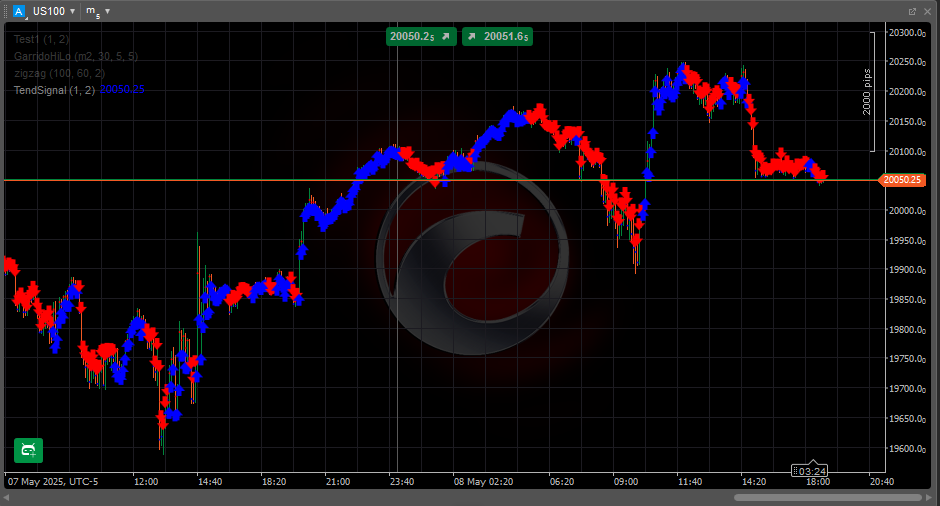
The PFO Price Flow Oscillator is a technical analysis tool designed to provide traders with a structured view of market momentum and volatility. It combines several market factors into a single normalized oscillator, allowing users to interpret price action more clearly in different conditions. The indicator is free to use and can be applied to Forex, commodities, indices, and other assets.


How It Works


The PFO oscillator calculates a normalized value (0–100) based on:


ATR (Average True Range): Scales readings in line with market volatility.


Moving Averages (EMA/SMA): Provide a trend baseline for momentum comparison.


Volume Analysis: Compares current activity with rolling averages to highlight stronger moves.


Price Action Factors:


Body size vs. range (candlestick strength).


Wick analysis (buying/selling pressure).


Directional bias (bullish vs. bearish movement).


Momentum vs. ATR: Measures deviation from trend relative to volatility.


Price-Move Weighting: Highlights significant bar-to-bar changes.


Smoothing & Normalization: Filters out noise and standardizes results on a 0–100 scale.


Reading the Oscillator


Above 75: Indicates stronger bullish conditions.


Below 25: Indicates stronger bearish conditions.


Around 50: Suggests neutral or consolidating market behavior.


Key Features


Multi-factor approach: integrates volatility, trend, volume, and price action.


Smoothed values for clarity and reduced noise.


Adaptive scaling that adjusts to different market conditions.


Works across multiple asset classes and timeframes.


Disclaimer: This indicator is intended for technical analysis purposes only. It does not predict future performance or guarantee trading results. Users should combine it with their own analysis and risk management practices.

More from this author
Indicator
forex
eurusd
xauusd
+3
Daily Open Color Zones
indicator showing the Daily Open Line and instantly shading bullish and bearish zones.
Indicator
forex
breakout
btcusd
+4
Market Bias Gauge
Measure Market Strength at a Glance – Instantly
You may also like
Indicator
xauusd
commodities
FVG_tidypips
A Fair Value Gap (FVG) indicator that identifies potential price imbalances, potential reversal and continuation zones
Indicator
breakout
supertrend
rsi
+1
Dynamic Trend Gradient
Identifies trends with moving averages & volatility. Base levels = bullish 🐂 or bearish 🐻 signals. Reversals detected!
DEnvelopSystem
DEnvelop is a high-performance trading indicator engineered for scalpers and intraday strategists who demand precision.
Indicator
forex
eurusd
xauusd
+3
Daily Open Color Zones
indicator showing the Daily Open Line and instantly shading bullish and bearish zones.
Trend Direction Force Index - TDFI (Alerts)
Spot Strong Trends Early & Filter Market Noise
Parabolic SAR Alert
Parabolic SAR Alert - Trend reversal alerts with smart signals & custom alerts.
JMA-Like
JMA-like is a highly responsive and ultra-smooth moving average designed to replicate the behavior of the original JMA!
Indicator
signal
TendSignal_indicator
Trend following signal
Zero Lag Exponential Moving Average
ZLEMA (Zero Lag EMA) is a faster, smoother version of EMA, ideal for capturing quick market shifts and trends.
price quote
price quote
Round Numbers
Automatically draws major, minor, and trace support/resistance levels at round numbers
HTFBB
Plot higher-timeframe Bollinger Bands for clearer structure, pullback zones, and breakout signals—without switching char
Repiptor Candlescope Lite
Candlestick pattern detector lite version
Indicator
forex
crypto
signal
+1
Engulfing Pattern Indicator
Indicator
signal
Half Trend BT
Half Trend BT by BullittTraders
Indicator
breakout
RT Standard Deviation Channel_noSourceCode
Visualize trends with Standard Deviation Channel! Display median, and add customizable upper/lower deviation channels.
AlgoCorner Market Sessions
Show each Market Session with full details, including grid mode for higher timeframes, statistics, and other metrics.
smma tel
Wstęgi HTS 33 144 mobile