Indicator
NAS100
NZDUSD
Breakout
XAUUSD
Commodities
Forex
EURUSD
GBPUSD
BTCUSD
Indices
Prop
Stocks
Supertrend
Crypto
USDJPY
Volume Meter
26/09/2025
Desktop

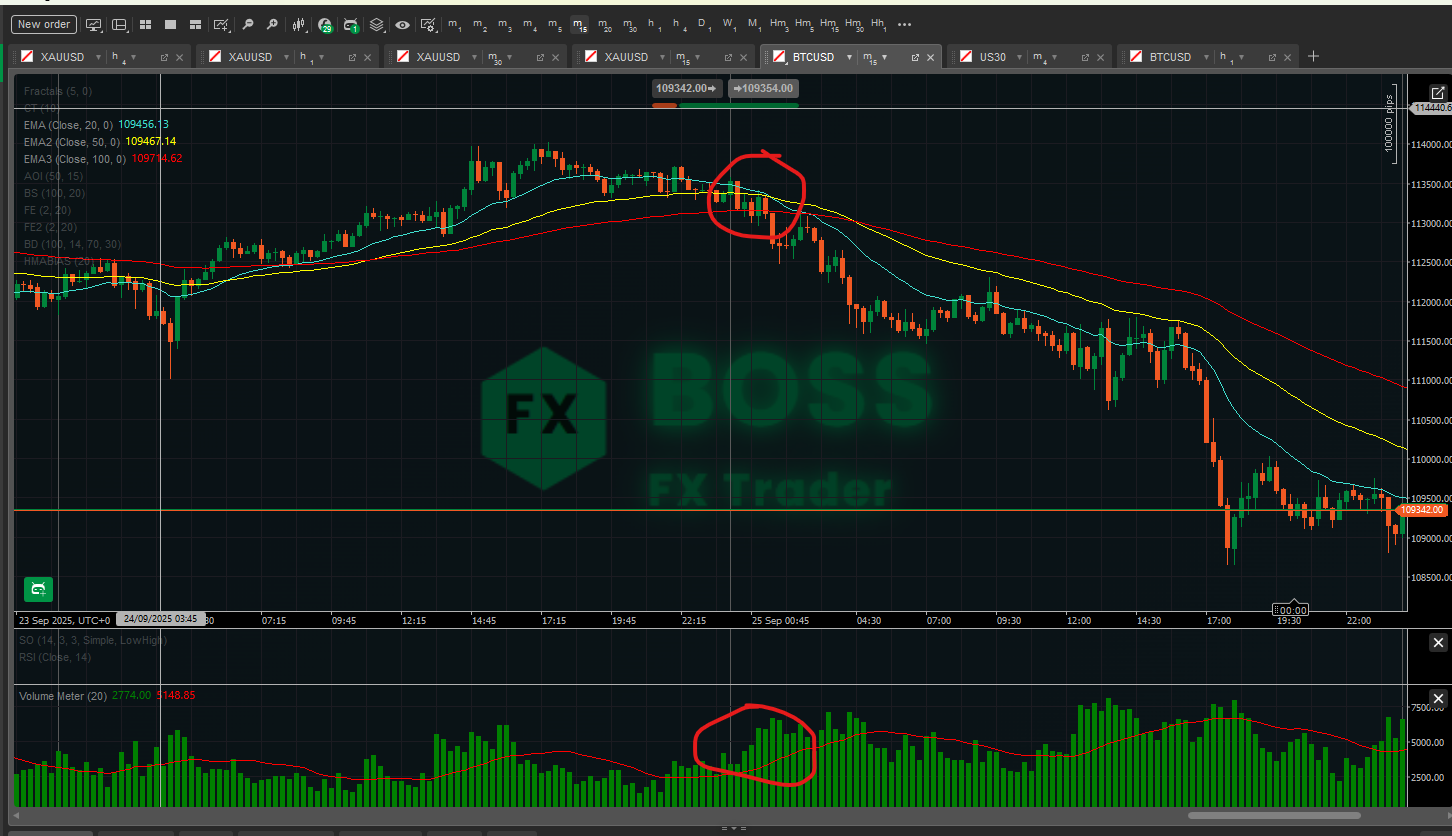
📘 What This Indicator Does
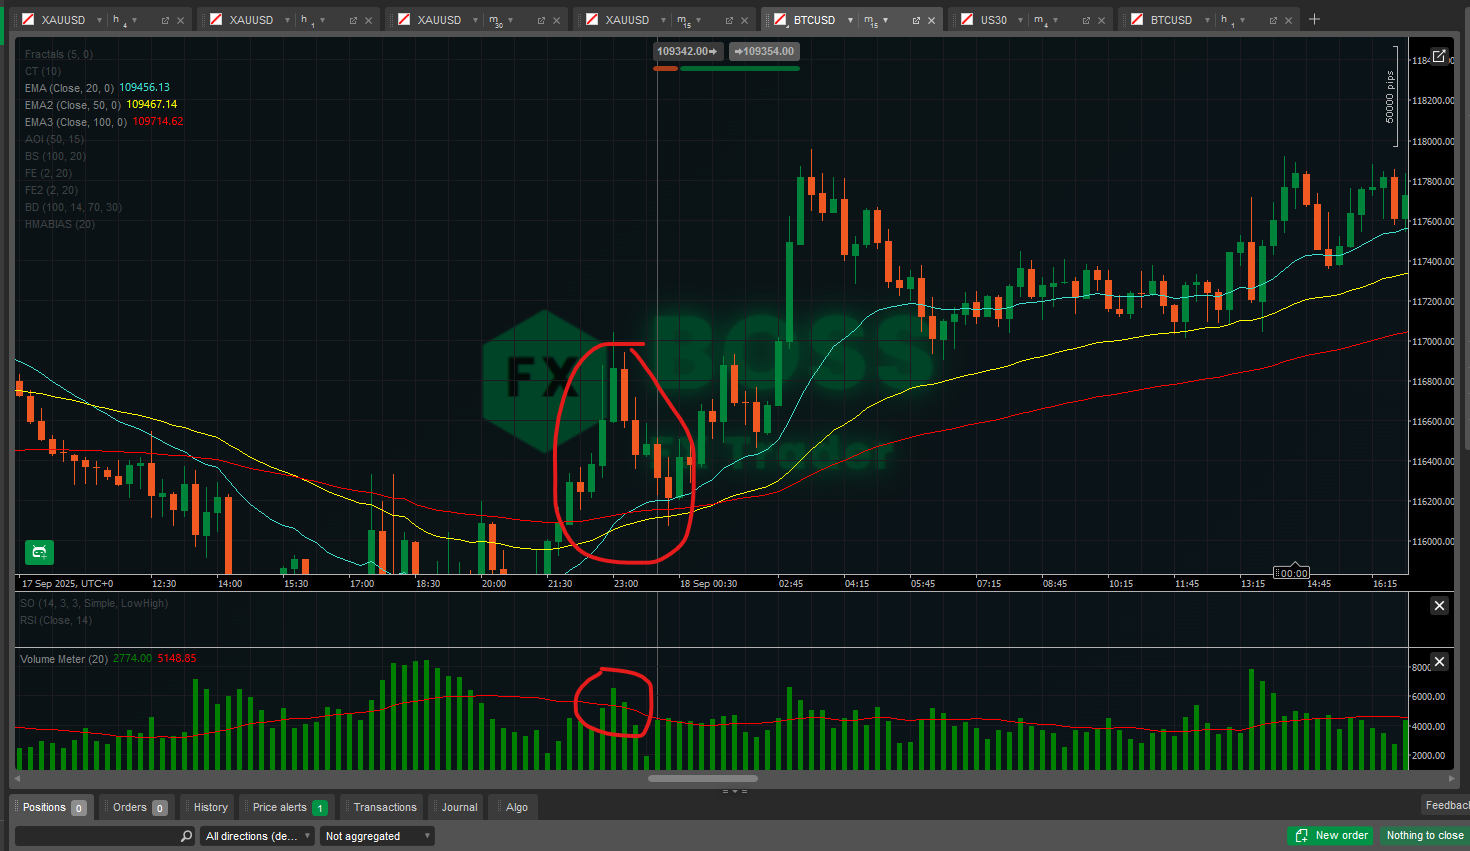
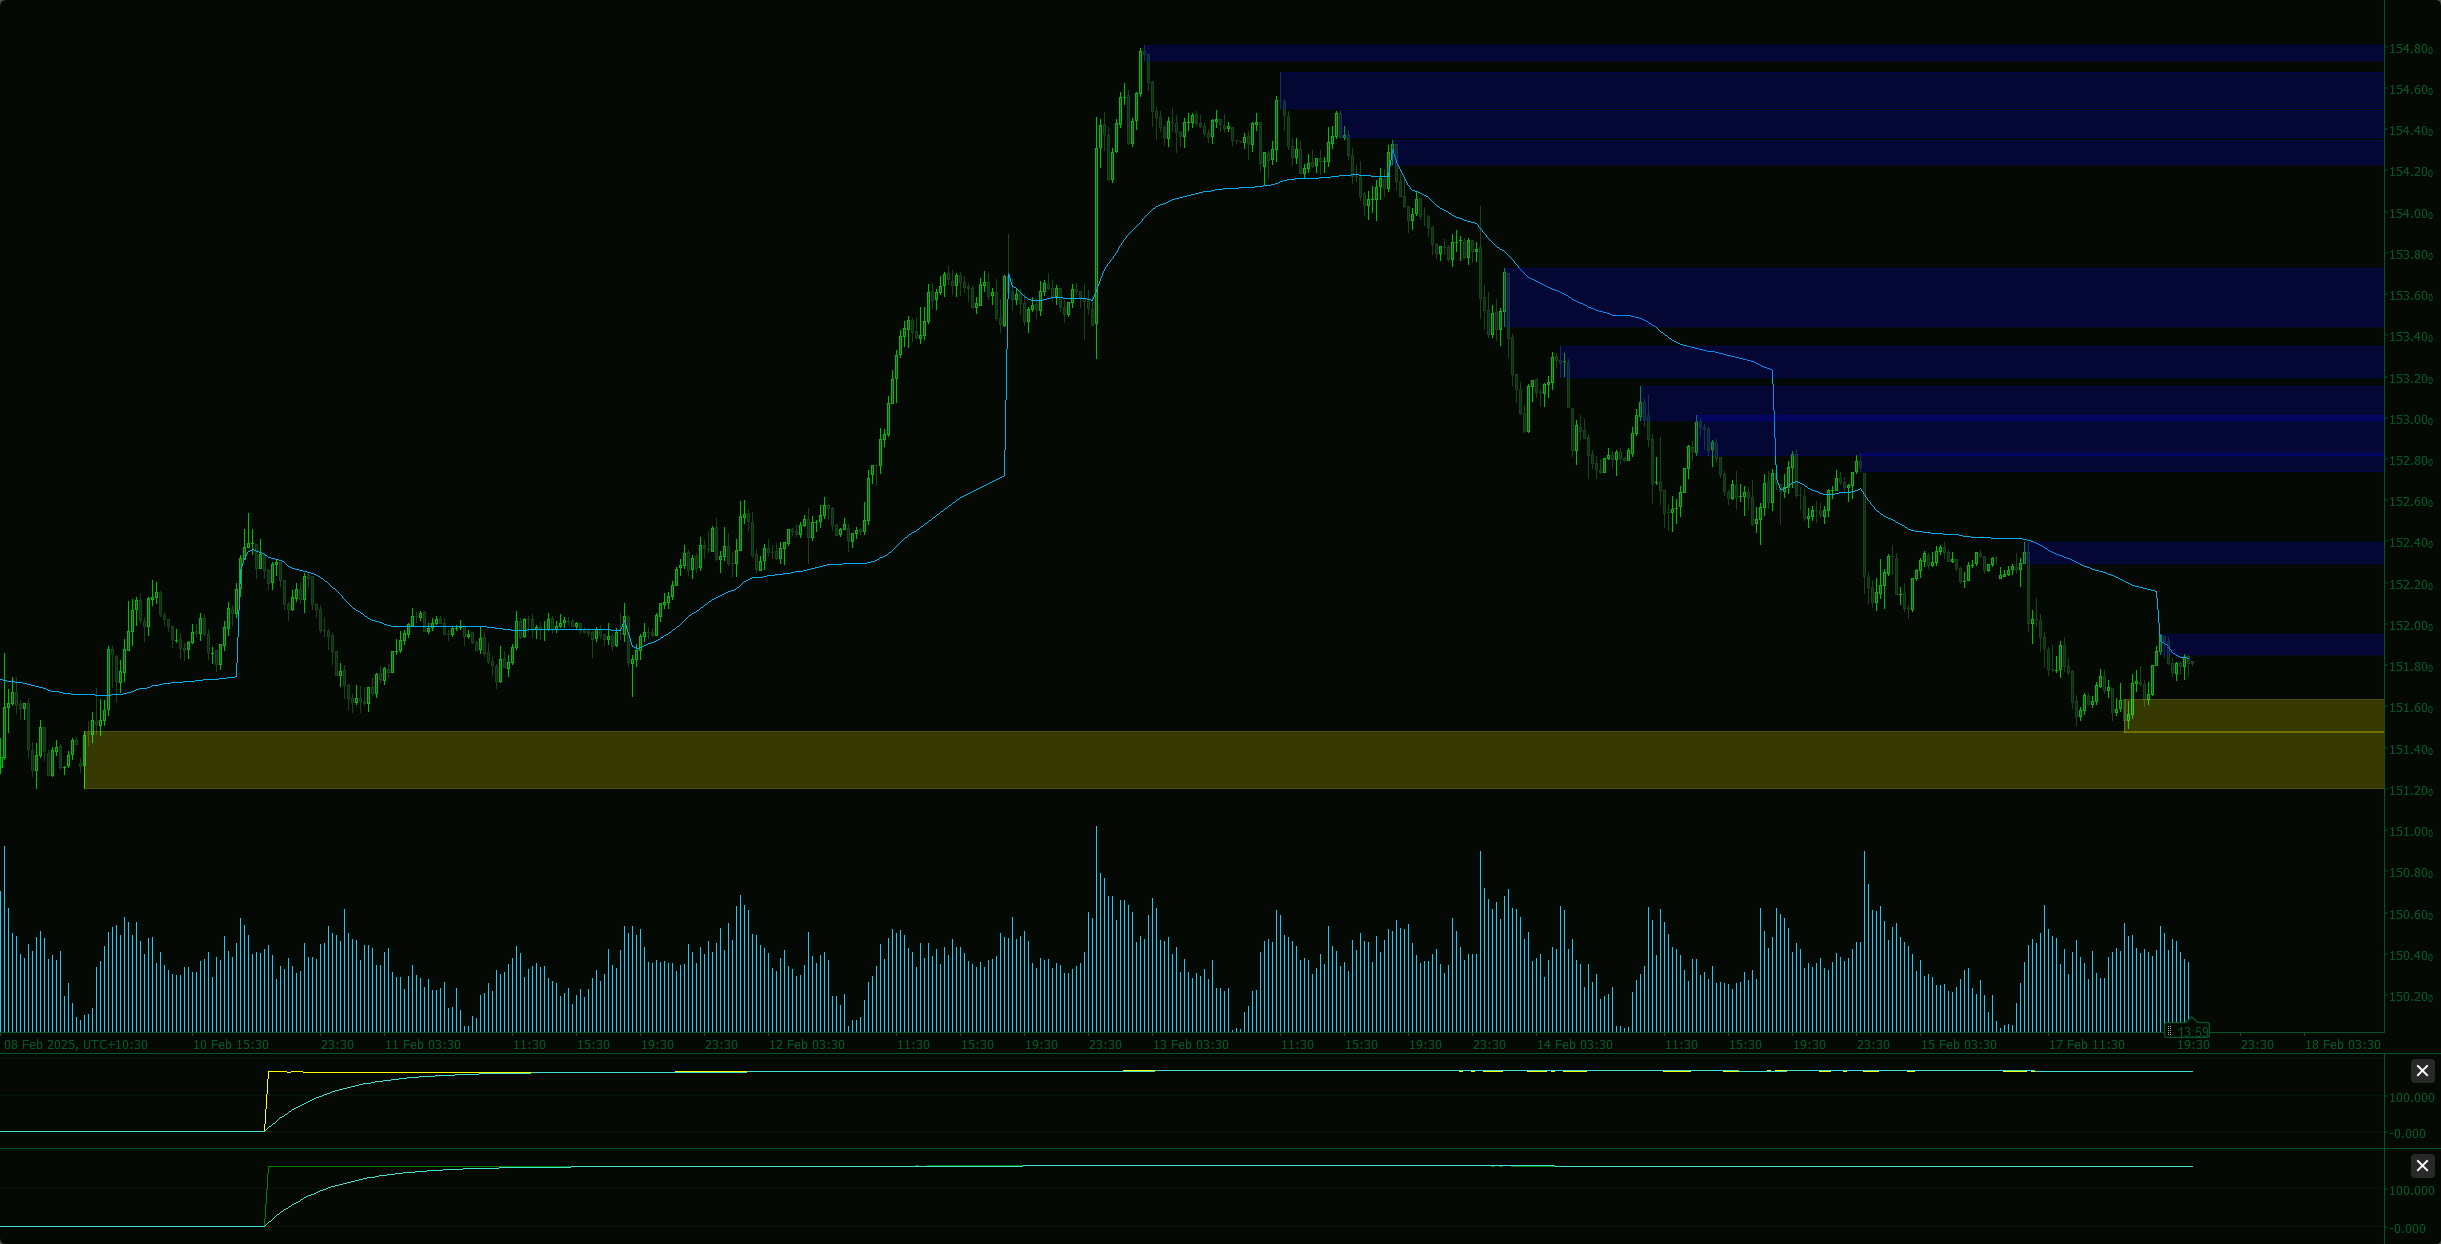
- It shows tick volume (number of price changes per bar) as a histogram.
- In Forex, brokers rarely provide real traded volume, so tick volume is used as a proxy.
- In stocks/CFDs/futures, you might get real volume.
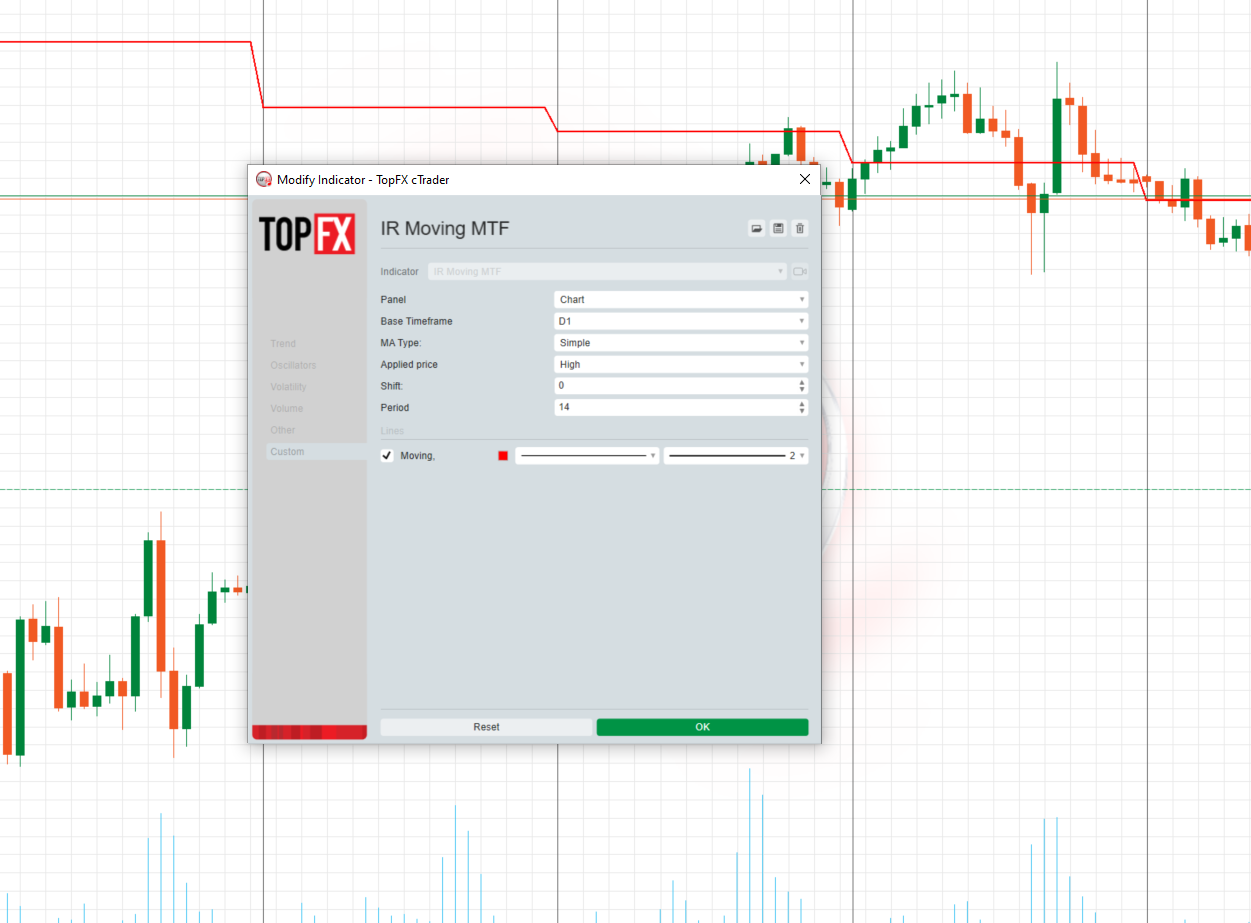
- It overlays a Moving Average of volume (default 20-period).
- This acts as a “baseline” to quickly spot whether the current bar’s volume is unusually high or low.
🎯 How to Use as Confirmation
The indicator is not a standalone signal generator. Instead, traders use it to confirm setups from other strategies:
- Breakout Confirmation
- If price breaks above resistance or below support, check if the breakout candle has volume above its MA.
- High volume confirms more participants are behind the move → breakout is more reliable.
- Low volume breakout = higher chance of false breakout.
- Trend Continuation vs. Exhaustion
- In a strong trend, pullback candles often have lower volume compared to impulse candles.
- If a pullback happens on low volume and the next move resumes with higher volume → confirms trend continuation.
- If you see the trend push continuing but volume dropping each push → possible exhaustion, prepare for reversal.
- Reversal Confirmation
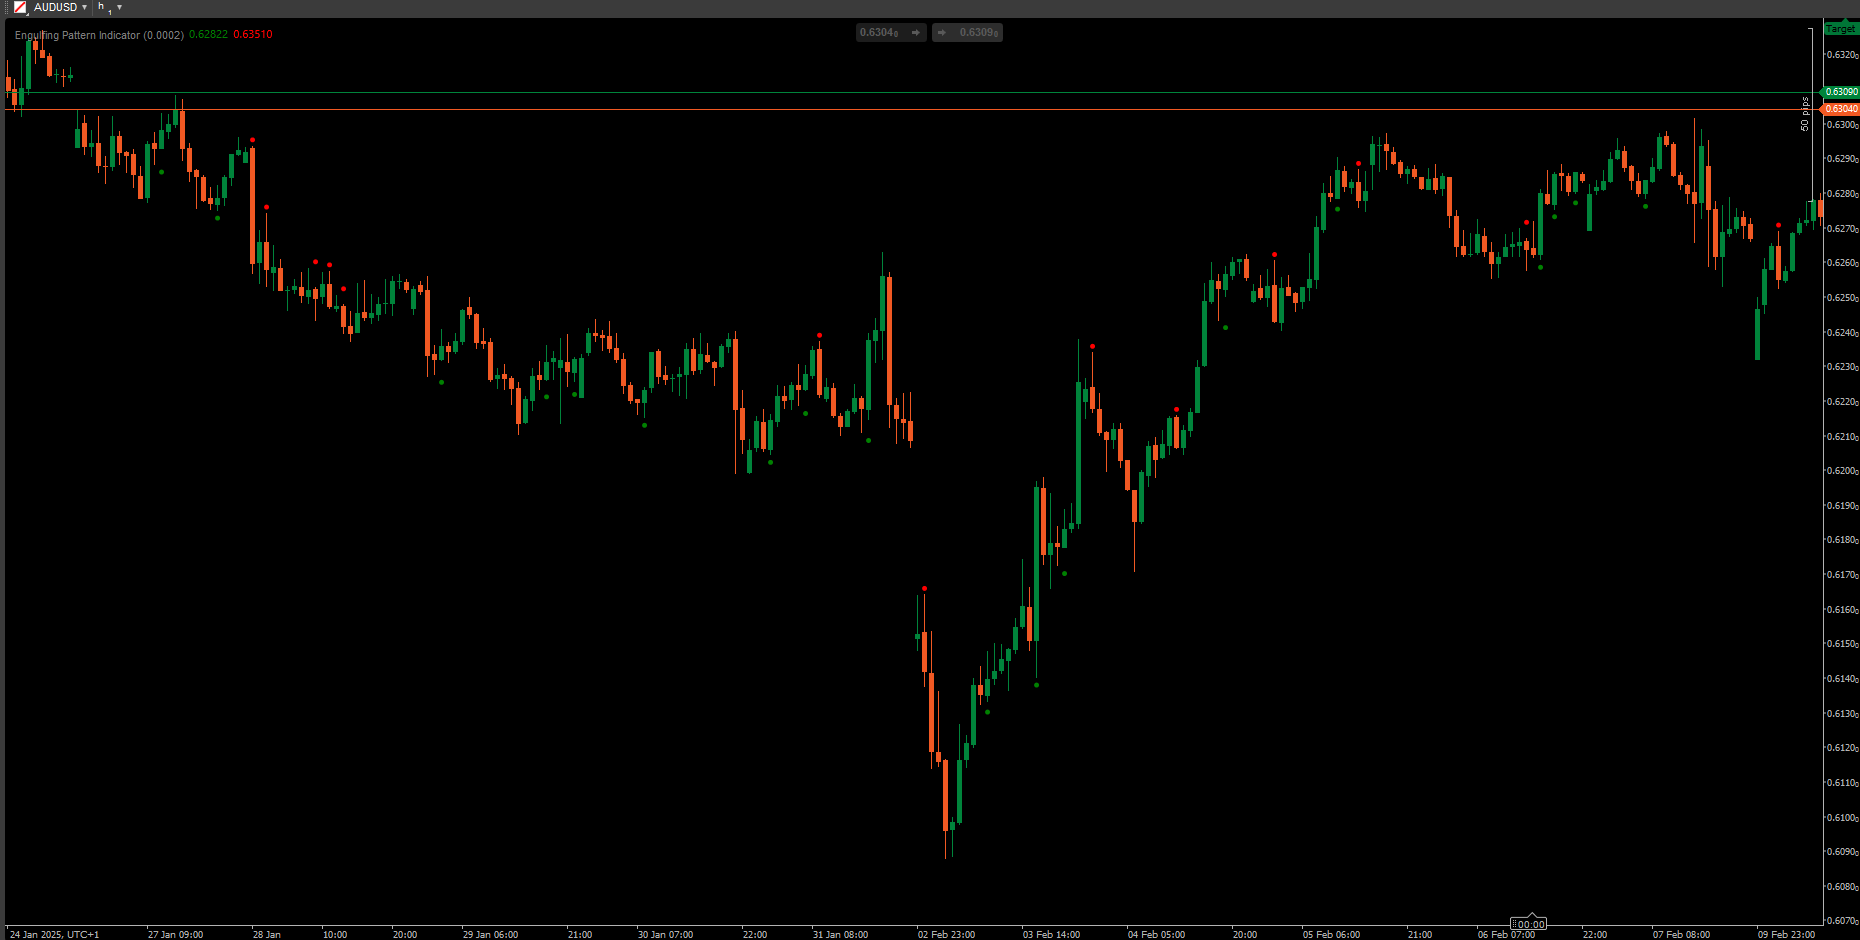
- Big reversal candles (pin bars, engulfing candles, fractals) are stronger if backed by a volume spike.
- Example: bullish pin bar at support with high volume = stronger reversal signal than same pin bar on low volume.
- False Signal Filter
- If your main system gives a buy/sell, but volume is weak (below average), you might choose to pass on that trade.
- Helps reduce overtrading and filter noise.
📊 Effectiveness
- In Forex: Tick volume has been shown to correlate strongly with real traded volume (70–90% correlation in many studies). So it’s useful, but not perfect.
- In Stocks/Futures/CFDs: Real volume makes this much more powerful since you’re measuring actual traded contracts/shares.
- As Confirmation: It’s best used with price action and other indicators (e.g., EMA, RSI, fractals). Relying on volume alone is risky.
- Strengths: Confirms breakouts, filters false moves, spots exhaustion.
- Weaknesses: Does not predict direction by itself — only adds confidence once you have a setup.
✅ Practical tip:
Use the indicator as a filter, not a trigger. For example:
- You see an EMA crossover (buy signal).
- Check: Is volume above its moving average? If yes → take trade. If not → wait.
This way you only trade when momentum is backed by market participation.
More from this author


Indicator
Forex
SpreadCalculator - BossFXTrader
Spread Calculator to calculate the difference between two prices or values.

You may also like
Indicator
Bollinger
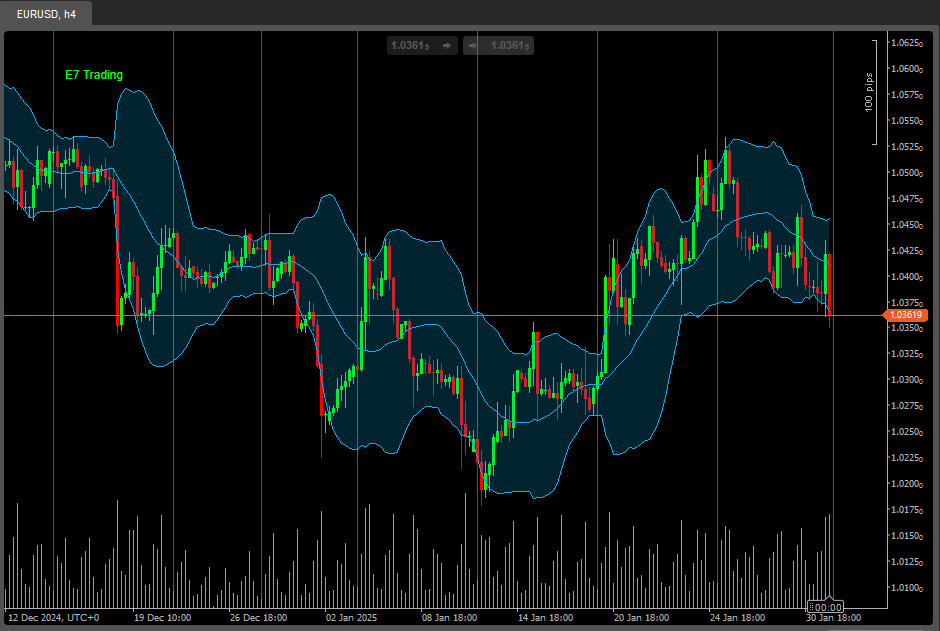
E7 Indicators Free Overlays
Bollinger Band Cloud, Heiken Ashi, Trend Follower and Parabolic SAR.

Popular

Indicator
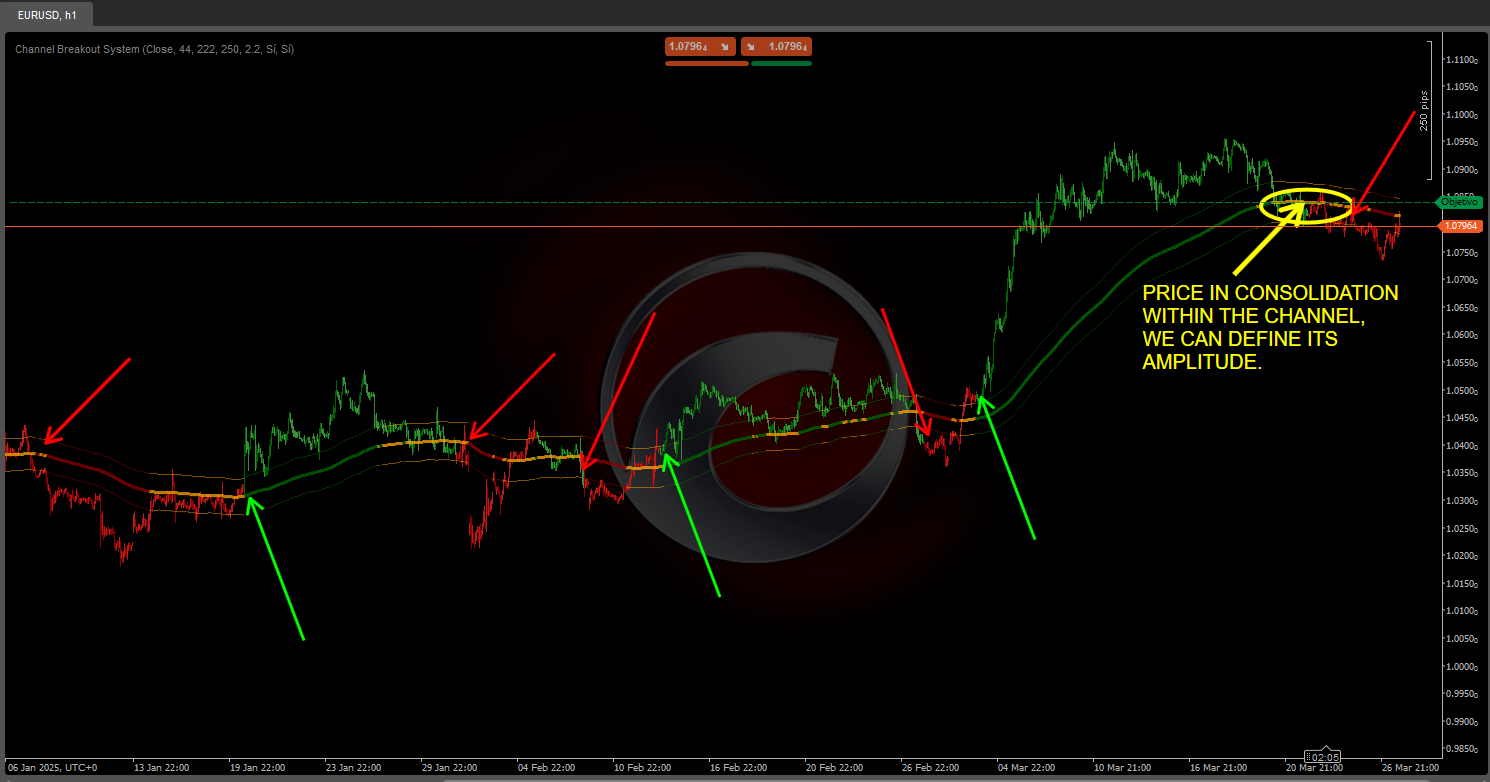
Breakout
VegaXLR - Fixed Range Volume Profile
Identify key support and resistance levels through detailed volume distribution analysis.
 w.jpg)