"STC" logo
STC
5.0
03/09/2025
204
Desktop
"STC" uploaded image

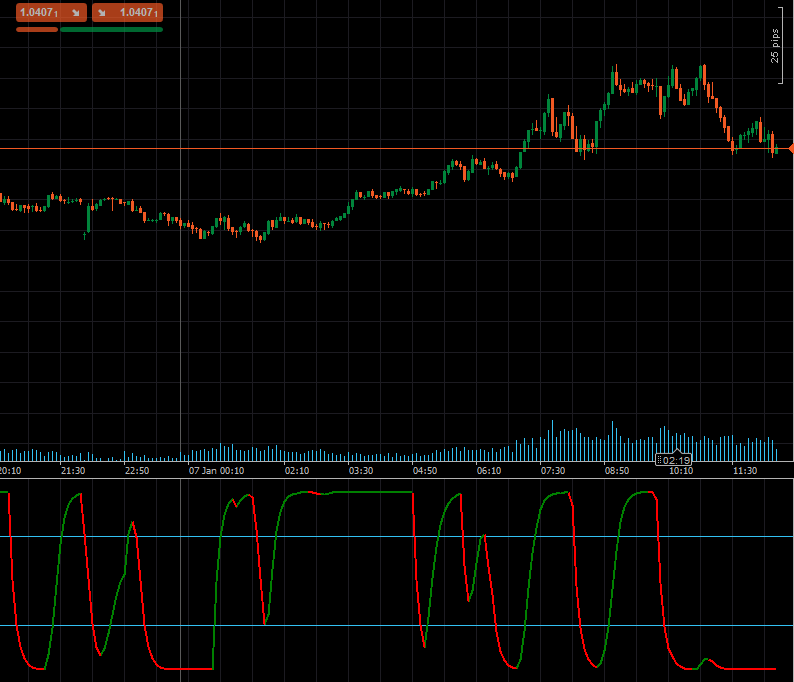
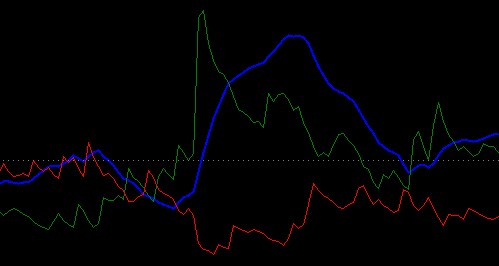
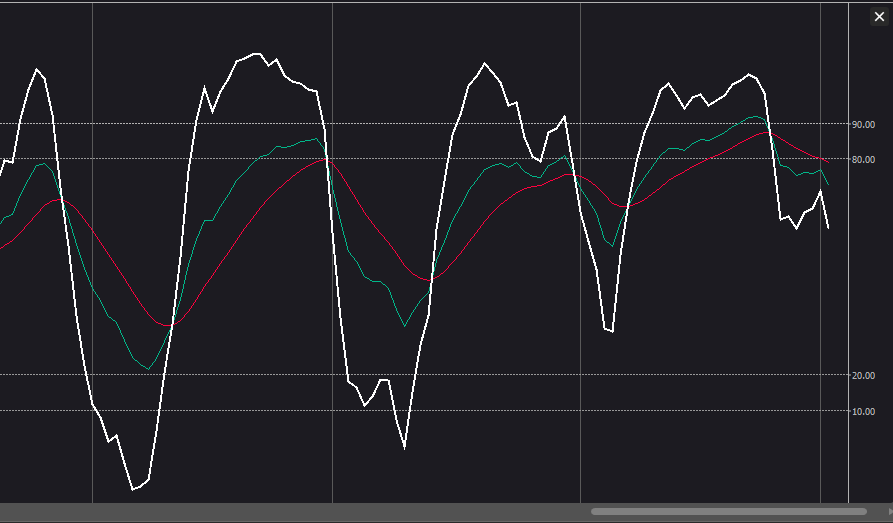
The Schaff Trend Cycle (STC), developed by renowned technical analyst Doug Schaff, is an advanced trading indicator designed to identify market trends and reversals with exceptional speed and precision. Rooted in the innovative idea of combining trend and cycle components, the STC leverages exponential moving averages (EMAs) and stochastic calculations to overcome the limitations of lagging indicators like MACD or Stochastic Oscillator. This unique approach provides earlier, more reliable trading signals, offering a significant edge in trend detection and market analysis.

Key Features:

  • Early Trend Detection: Combines exponential moving averages (EMAs) with stochastic calculations to capture trends faster.
  • Customizable Settings: Adjust length, fast MA, slow MA, MA type and smoothing factor to suit your trading strategy.
  • Visual Alerts: Dynamic color changes indicate bullish or bearish trends, making it easy to interpret market conditions.
  • Support for Overbought/Oversold Levels: Built-in levels (25 and 75) help identify potential market turning points.

Parameters

  • Length: Defines the number of periods for trend calculation.
  • Fast MA Length: Sets the length of the fast-moving average.
  • Slow MA Length: Specifies the length of the slow-moving average.
  • MA Type: Allows selection of the moving average type (e.g., EMA, SMA).
  • Smooth Factor: Adjusts the smoothing factor for refined trend signals.

Outputs

  • STC: Outputs the primary Schaff Trend Cycle value, representing trend direction and strength, for programmatic use in automated trading systems.
  • STCBull: Highlights bullish trend conditions.
  • STCBear: Highlights bearish trend conditions.


More from this author
Indicator
breakout
PDHL
PDHL - Previous Day High&Low
DataWindow
An MT-style Data Window for enhanced data visualization – hope this will be helpful!
ColorfulTickVolume
Change the color of Tick Volume based on the price movement
ColorfulTickVolumeV2
Changes the Tick Volume color based on price movement, synchronized with BullFillColor and BearFillColor in ColourOption
cTraderStore
Instant access to the cTrader Store for discovering cBots, indicators, and plugins.
You may also like
E7 Polynomial Regression Channel
Polynomial Regression Channel which also reflects the volatility of the underlying asset.
KANDIKA HEAT MAP
Color-Based Market Pressure & Volatility Visualizer The Kandika Heatmap Indicator
Pivot Points
Pivot Points Indicator
vpdi
VPDI (open, close, high and low with % of the previous day and price changes in % of the previous day's close)
RSI T3 Overbought and oversold areas
Three parameter RSI
Indicator
forex
crypto
scalping
+1
Market Structure SNR + Auto Bias
Market Structure Indicator – Your Trading Map in a Noisy Market. No more Panicking Which one, Where, Why and How.
Indicator
breakout
ai
scalping
KaufmanEfficiencyRatio
A precision tool for measuring how efficiently price moves from point A to B.
IR Slowing Moving
Add Slowing to IR Moving Average.
Supertrend Indicator v1.1
SUPERTREND INDICATOR v1.1
Indicator
forex
prop
indices
+8
FREE Squeeze Momentum from TradingView
Squeeze Momentum - Anticipate explosive market moves before they happen
SmartBot-Tenkan & ATR Indicator
The Tenkan-ATR Indicator is a powerful and innovative indicator for Traders. SALE OFF!!!
VegaXLR - ZigZag Alerts
cTrader ZigZag Alerts: Precision Swing Detection, Alerts, and Fibonacci.
Indicator
indices
CustomADX
Custom ADX Indicator for precise trend analysis. المؤشر المخصص ADX لتحليل الاتجاه بدقة
Open Trade ProfitV1
A simple indicator that tracks the value of your open trades in pips.
Time zone pro
FREE Global Trading Sessions Indicator
Top-rated
Renko Wicks
Renko Wicks
FVG
The Indicator is a powerful tool for price-action traders seeking to identify and exploit short-term imbalances.
Indicator
forex
breakout
btcusd
+9
Advanced HTF Trend Buy & Sell Trading System
Detects breakouts 📈 auto-draws levels 🚀 confirms trends 🐻 dynamic signals 🎨 customizable for any asset & timeframe.