Automatic Fibonatti
"Automatic Fibonatti" logo
01/09/2025
1
Desktop
Since 05/02/2025
Sales
11

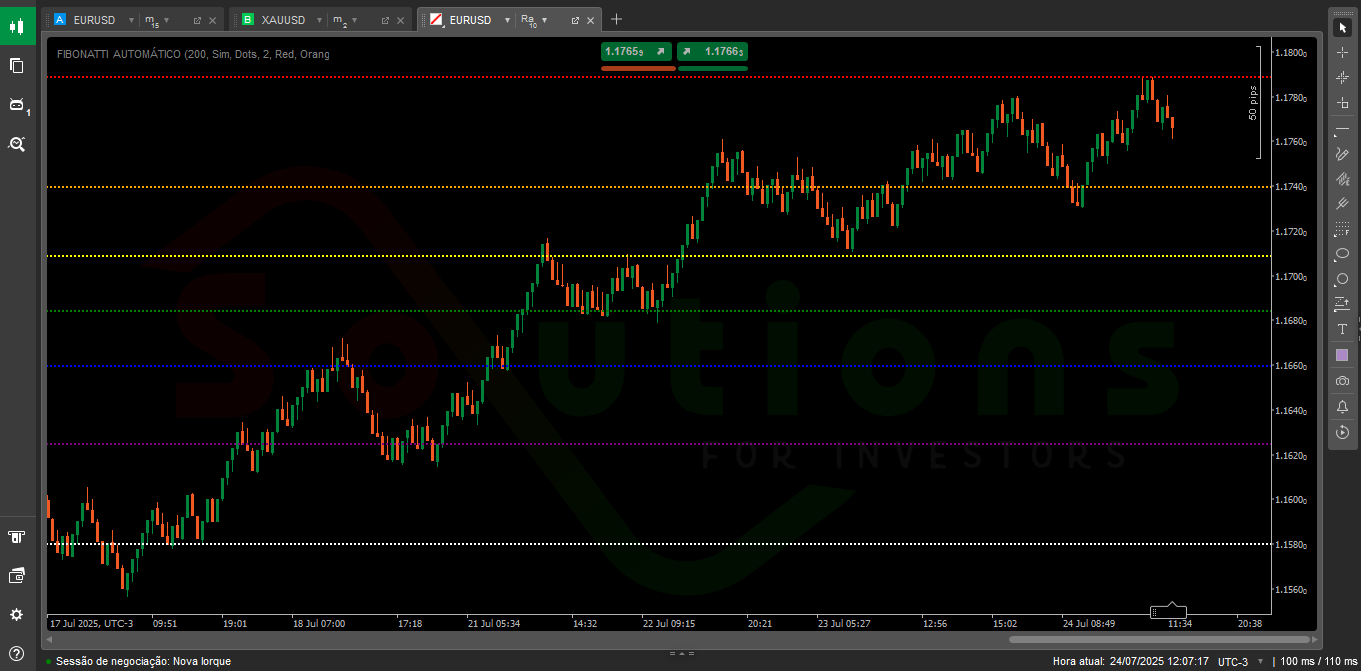
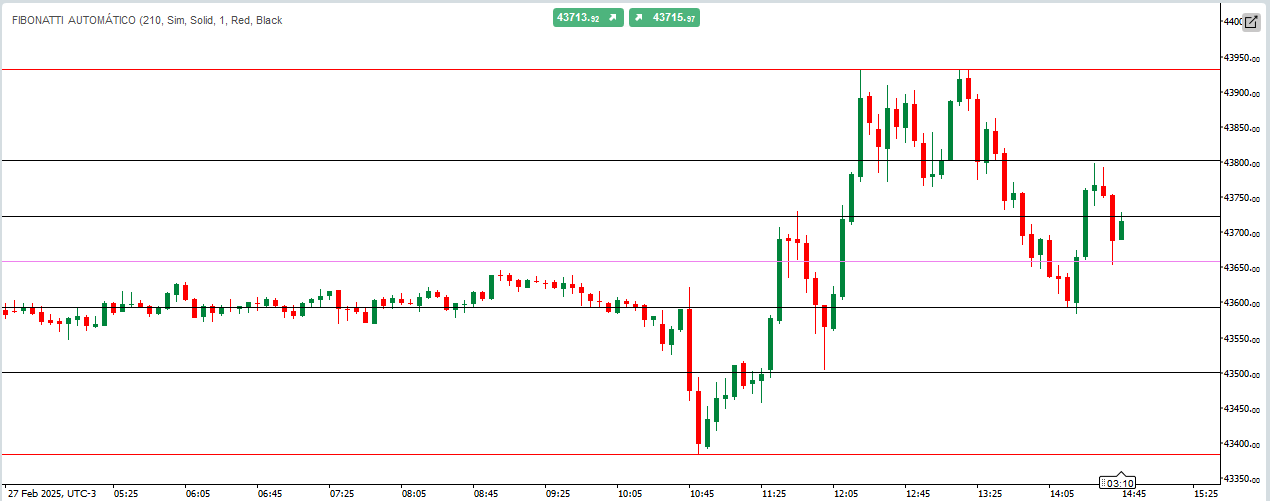
Auto Fibonacci for cTrader


Automatically identify key price levels — fully customizable to your strategy.
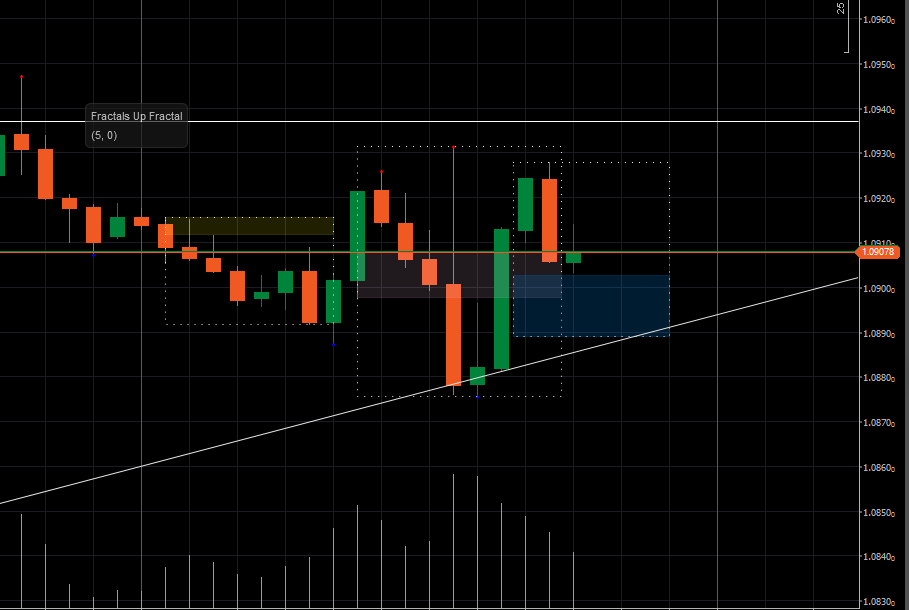
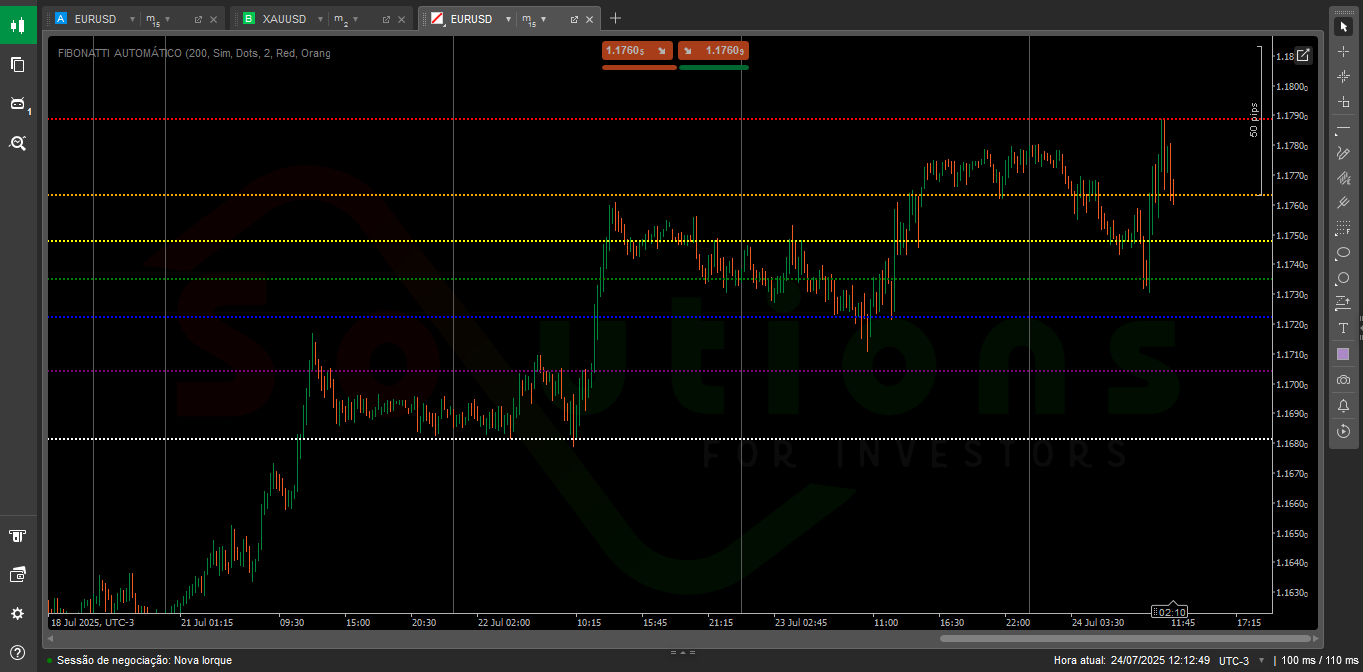
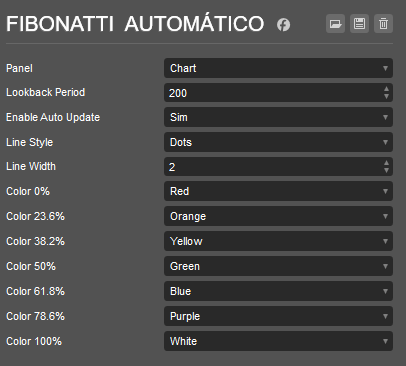
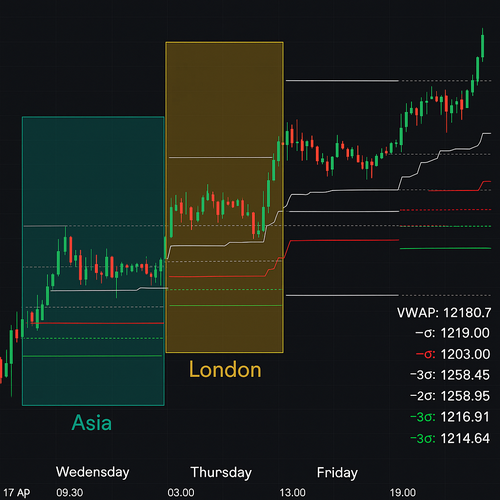
Auto Fibonacci is a smart and flexible indicator that automatically draws Fibonacci retracement levels based on the highest and lowest prices over a user-defined period. What sets it apart is its full customization: personalize each Fibonacci level’s color, line style, and thickness to suit your visual preferences and trading strategy. It also features real-time updates, so your chart always reflects the latest price action — no manual adjustments needed.

More from this author
Renko Reversal
Renko Reversal catches powerful wick rejections on cTrader.
VolumeColorBar
Color Volume Bars – Visualize Market Strength Instantly
Indicator
Breakout
VIX - volatility indicator
Ride the Volatility – Smart VIX Tool
BOT REJECTION - SOLUTIONS FOR INVESTORS
Rejection Bot – Precision Trading at Key Levels
Automatic Fibonatti - Renko
Automatically plots Fibonacci retracement levels using the highest and lowest points of a customizable time range.
Indicator
Indices
Prop
Commodities
+3
ADX Indicator_noSourceCode
Identify Trend Strength with Absolute Precision on cTrader
Indicator
Breakout
VIX - volatility indicator - Renko
Volatility indicator for Renko.
Indicator
Indices
RSI
RSI
RSI Pro Tool – Overbought & Oversold Made Easy
You may also like
Dynamic Candle Timer v1.5 2025
Dynamic Candle Timer is a fully customizable feature-packed indicator that offers multiple count-down/up modes and...
Indicator
Indices
Breakout
Forex
+2
Time zone pro
FREE Global Trading Sessions Indicator
Indicator
Signal
MACD
MacD Custom Indicator Multi Time Frame
MacD Custom Indicator-Multiple Time Frame+All Available Options!
BWMFI_Visual
BW_MFI Vizual colors bars
Top-rated
Free
BarSentiments
This Indicator is a technical analysis tool that measures the strength and direction of market sentiment
RT TradingView ATR
Upgrade to ATR-RMA! Experience the precise ATR using Relative Moving Average for accurate volatility analysis in cTrader
[Hamster-Coder] Pivot Points (Demo)
[Hamster-Coder] Pivot Points (Demo)
Previous Day Liquidity Zones (PDH - PDL)
Useful indicator for traders who want to visualize key price levels based on previous daily highs and lows.
Market Sessions Advanced
Advanced Market Sessions with ICT killzones
Indicator
NAS100
NZDUSD
XAUUSD
+10
MarketSession-MX
😎Read the description before purchasing💩
Indicator
RSI
Breakout
Lozano Price Action
LPA simplifies trading by coloring candles with volume data and RSI levels for trend and reversal insights.
Indicator
VWAP
Breakout
Scalping
VWAP & Sessions & D,W,M HLO Levels
Killzone Session With VWAP – Precision Meets Price Action
Multi Volume Profile
Advanced customizable volume-profile indicator with buy/sell levels, delta analysis, multi-TF support and vivid gradient
[Hamster-Coder] Pivot Points
[Hamster-Coder] Pivot Points (Standard)
LDE - Market Sessions
🇫🇷 Visualisez vos sessions de marché et OPR d'un coup d’œil 🇬🇧 Visualize your market sessions & OPR at a glance !
Parabolic SAR Alert
Parabolic SAR Alert - Trend reversal alerts with smart signals & custom alerts.
Dhruvin Wick Candelssss
RSI‑powered robot for high‑volatility scalping, no fuss.
LT_FairValueGap
Detects valid Fair Value Gaps from strong 3-bar patterns. Keep drawing unfilled gaps until price fills them.