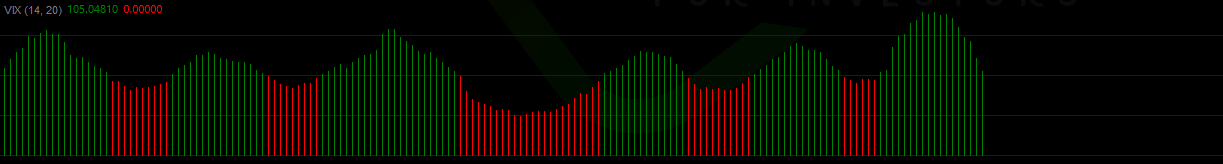
VolumeColorBar
"VolumeColorBar" logo
01/09/2025
3
Desktop
Since 05/02/2025
Sales
11

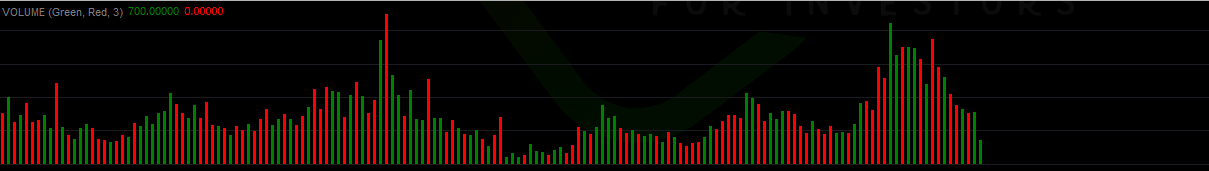
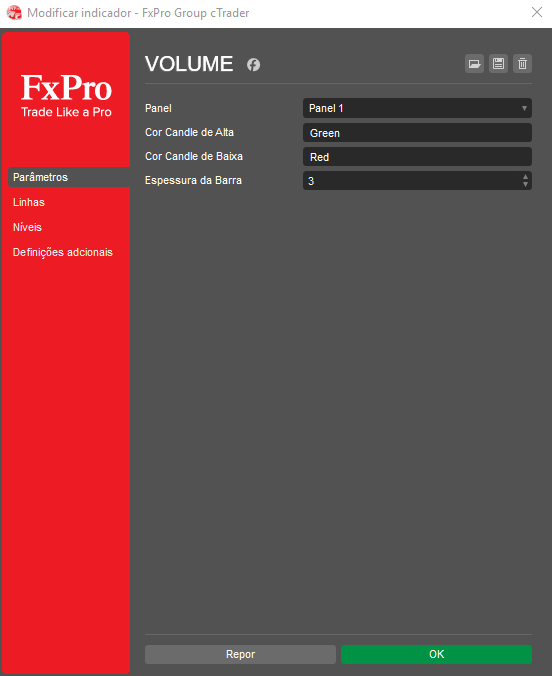
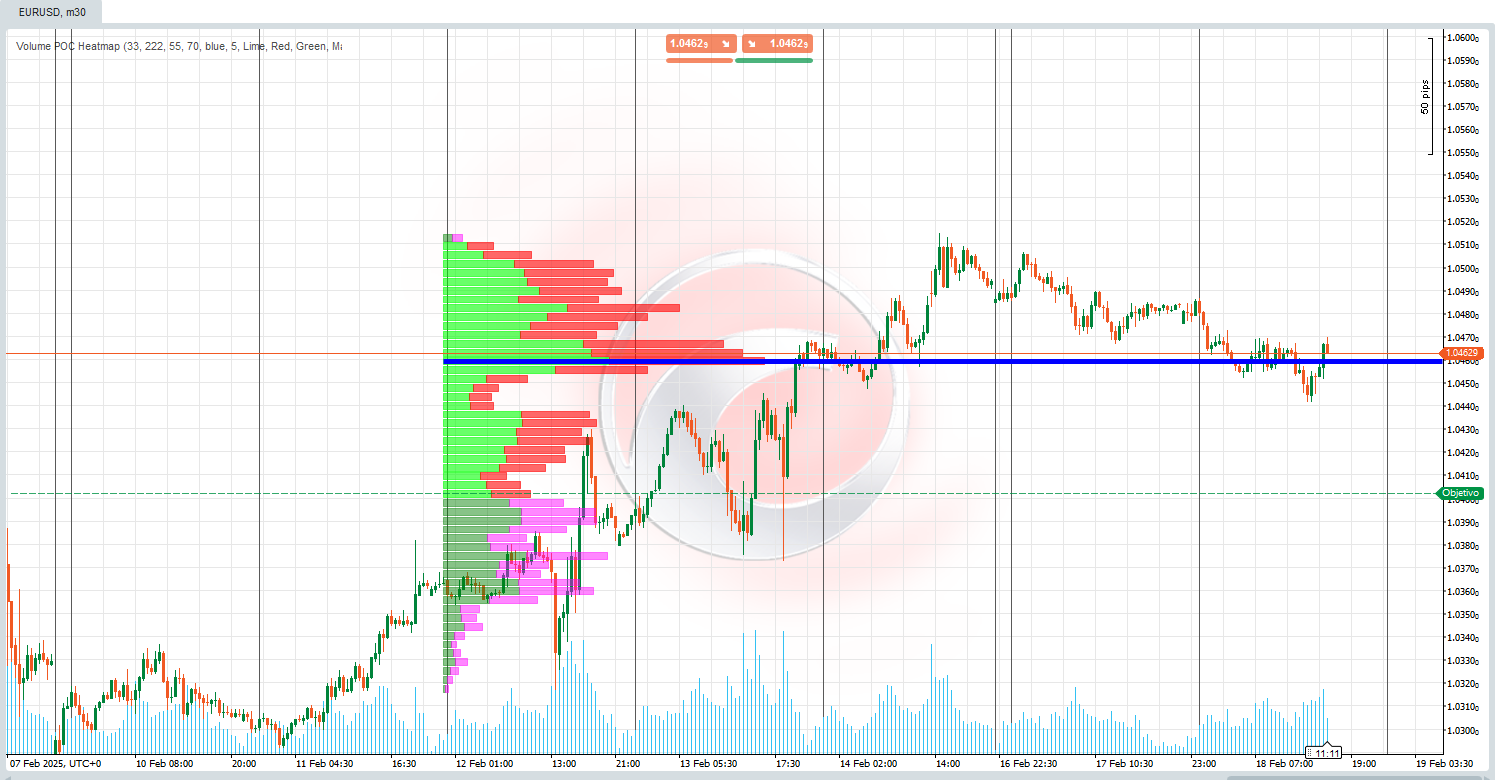
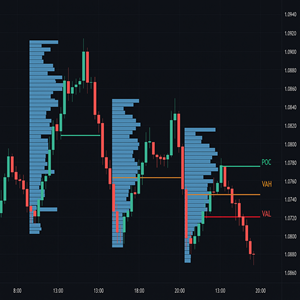
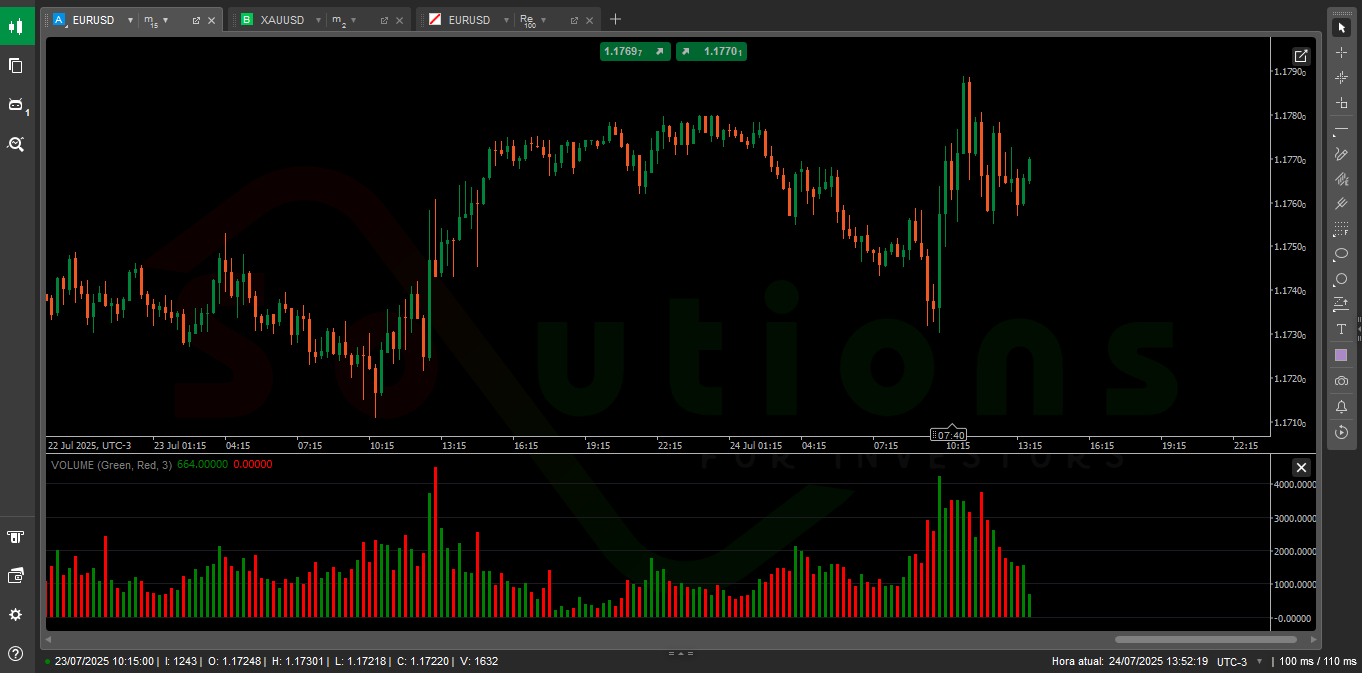
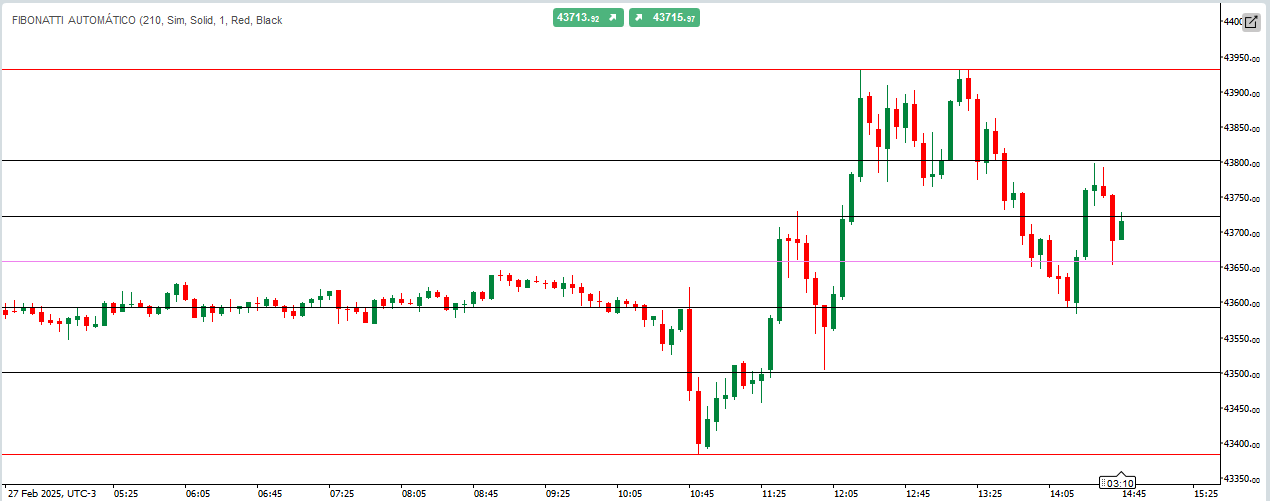
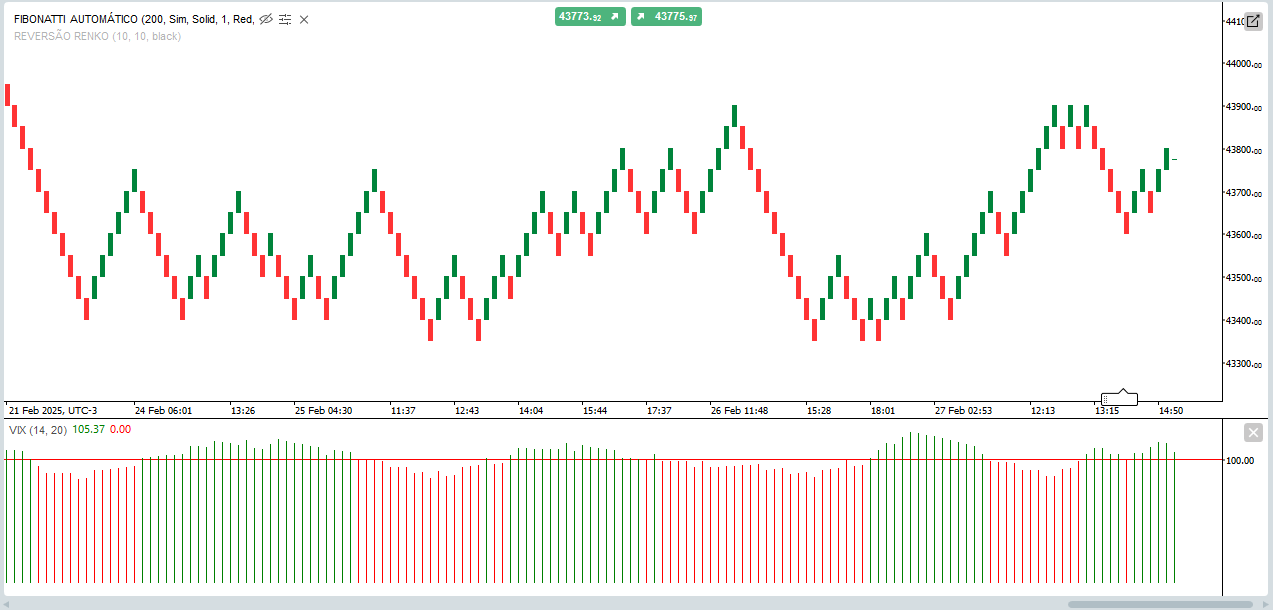
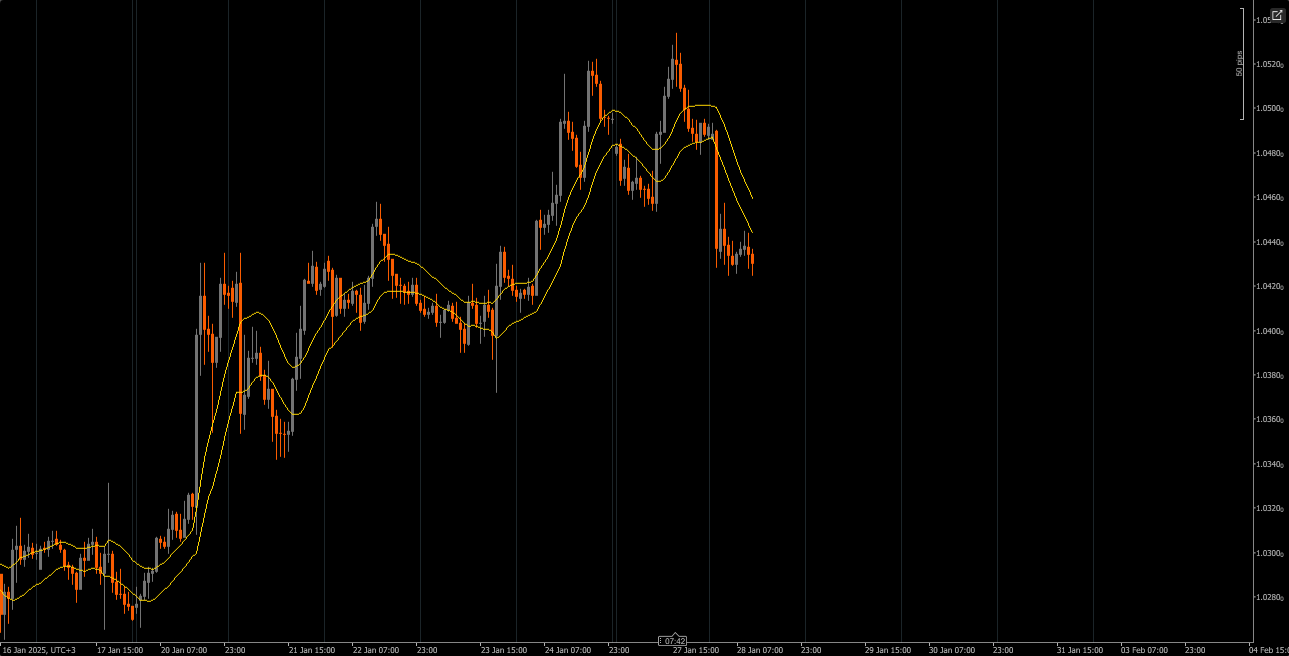
VolumeColorBar is a powerful tool that visually represents market volume using color-coded bars based on candle direction. Green bars indicate volume on bullish candles (buying pressure), while red bars reflect volume on bearish candles (selling pressure). This allows traders to instantly assess whether the market activity is driven more by buyers or sellers — helping confirm breakouts, identify reversals, and improve trade timing with greater confidence.

More from this author
Renko Reversal
Renko Reversal catches powerful wick rejections on cTrader.
Indicator
Breakout
VIX - volatility indicator
Ride the Volatility – Smart VIX Tool
Automatic Fibonatti
Automatically plots Fibonacci retracement levels using the highest and lowest points of a customizable time range
Indicator
Indices
RSI
RSI
RSI Pro Tool – Overbought & Oversold Made Easy
BOT REJECTION - SOLUTIONS FOR INVESTORS
Rejection Bot – Precision Trading at Key Levels
Indicator
Indices
Prop
Commodities
+3
ADX Indicator_noSourceCode
Identify Trend Strength with Absolute Precision on cTrader
Automatic Fibonatti - Renko
Automatically plots Fibonacci retracement levels using the highest and lowest points of a customizable time range.
Indicator
Breakout
VIX - volatility indicator - Renko
Volatility indicator for Renko.
You may also like
Indicator
NAS100
NZDUSD
Martingale
+22
Candle Timer
Candle Timer best used for Scalper
Volume Weighted Average Price
VWAP is a powerful tool for intraday traders
Moving Average channel
This indicator is designed to display customizable moving averages (MAs) on a chart.
Previous Day Liquidity Zones (PDH - PDL)
Useful indicator for traders who want to visualize key price levels based on previous daily highs and lows.
Indicator
Indices
Stocks
Forex
+4
MACD Pro Trader
🚀 MACD Pro Trader – Advanced MACD with buy/sell signals, custom MAs & color-coded histograms for smarter trading! 📈🔥
Indicator
Indices
Commodities
Stocks
+2
MARainbow
MARainbow gives you the edge with four customizable moving averages—each color-coded for instant recognition.
Indicator
Bollinger
Repiptor BB Colored Width
Colored Bollinger Bands Width
Indicator
Indices
RSI
RSI
RSI Pro Tool – Overbought & Oversold Made Easy
smma tel
Wstęgi HTS 33 144 mobile
RSI T3 overbought and oversold area
Market Sessions
Market Sessions is very important for traders.
VWAP_MTF
📊 VWAP with MTF & Dynamic Deviation Bands
Indicator
RSI
Breakout
XAUUSD
+6
Volume POC Heatmap
📊 Shows volume by price levels, highlights POC, and key zones. Identifies dynamic support/resistance and imbalances.
Indicator
NAS100
NZDUSD
XAUUSD
+12
Market Profile Pro_noSourceCode
Market Profile Pro: Volume-based POC/VAH/VAL levels, configurable sessions, transparent histograms, multi-day support
Indicator
NAS100
RSI
NZDUSD
+18
HAIQuantum-V10
The HAI Quantum V10 is an advanced indicator designed for technical analysis
Indicator
Commodities
Forex
Compra e Venda
Indicador Compra e Venda é um rastreador de tendência.
BarCount
Bar count
E7 BBKG Indicator
E7 BBKG indicator with 80% plus accuracy used to show both, possible reversal and trend.