


Descripción
La configuración de day-trading más probada en batalla, totalmente automatizada en tu gráfico.
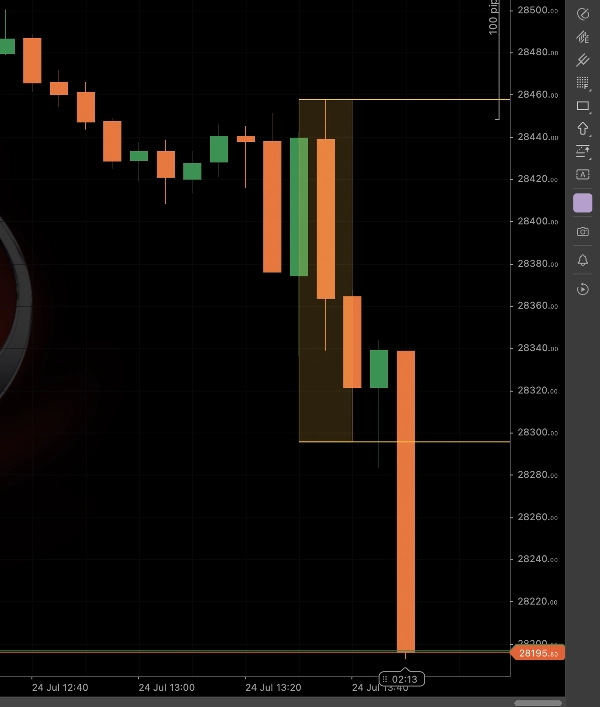
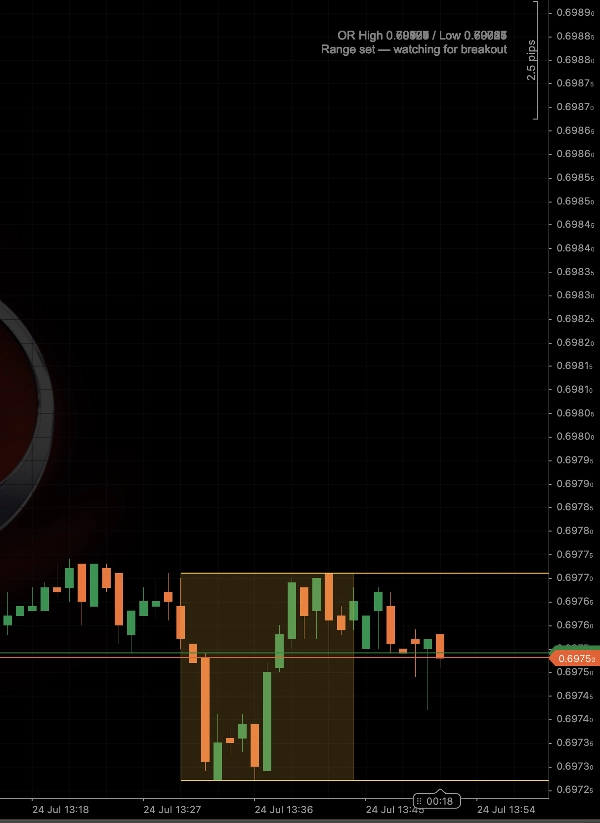
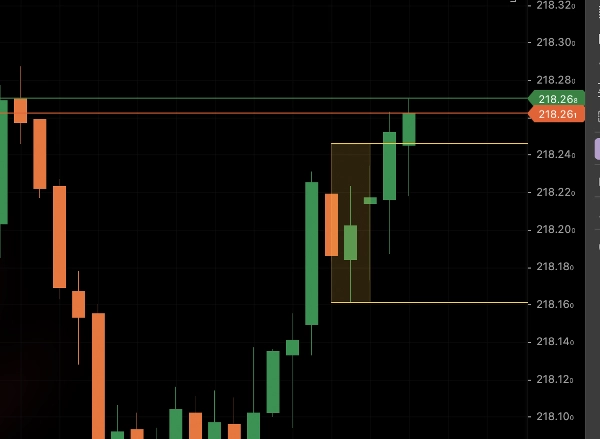
Opening Range Breakout traza el máximo y mínimo de los primeros minutos después de que la sesión abre, luego te indica el momento en que el precio se compromete a una ruptura real — no solo un toque de mecha a través del nivel.
Lo que analiza:
- Rango de Apertura — el máximo/mínimo de una ventana configurable justo después del inicio de tu sesión (por defecto: 9:30 ET, 15 minutos — la clásica apertura NYSE ORB)
- Confirmación de Ruptura — solo se activa en el cierre completo de una vela close más allá del rango, filtrando falsas rupturas que solo atraviesan con la mecha y luego revierten
- Filtro de Aumento de Volumen — opcionalmente requiere que el volumen de la vela de ruptura supere un múltiplo del promedio reciente, para que operes con convicción, no con ruido
Cómo leerlo: el rango se imprime como un cuadro sombreado con dos líneas extendidas mientras se forma. En el instante en que se confirma una ruptura válida, todo el cuadro y ambas líneas cambian a verde negrita (long) o rojo (short), con una etiqueta clara "LONG BREAKOUT" / "SHORT BREAKDOWN" justo en la vela de señal. También funciona a lo largo de todo el historial de tu gráfico, para que puedas desplazarte hacia atrás y ver exactamente cómo se desarrolló el rango de cada sesión anterior.
Configuraciones clave: Hora de inicio OR (ET), Duración OR (minutos), Multiplicador de Volumen, longitud de Extensión de Línea y un interruptor para el cuadro sombreado.
Más adecuado para: traders intradía en marcos temporales bajos (1–15 min) que operan acciones, índices o futuros con una apertura de sesión definida — esta es la configuración más mecánica y basada en reglas en el day trading minorista, y esta herramienta elimina completamente el dibujo manual del rango y la observación de rupturas.
Resumen
Valoraciones de clientes
Conversación
Preguntas frecuentes
Más de este autor




























Precio