
설명
### 설명
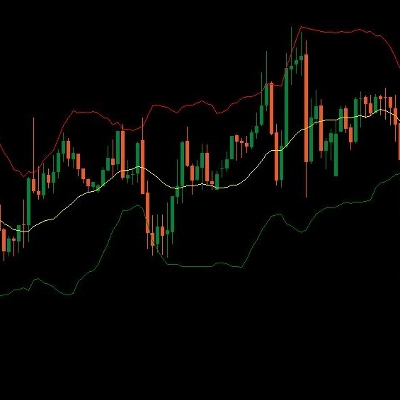
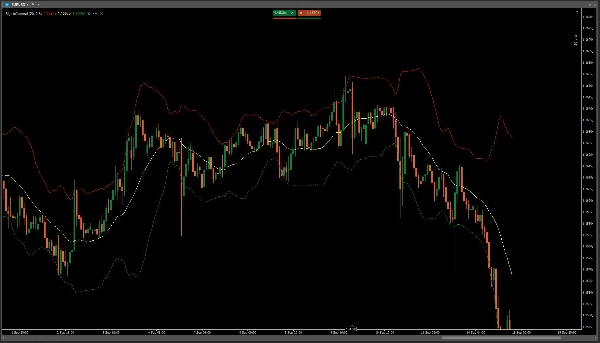
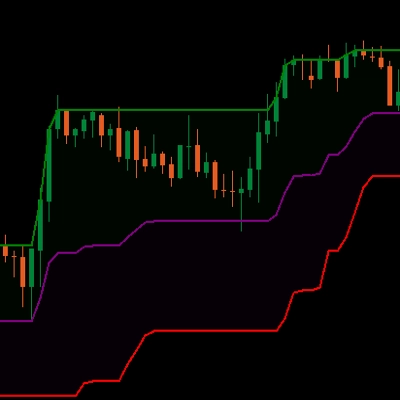
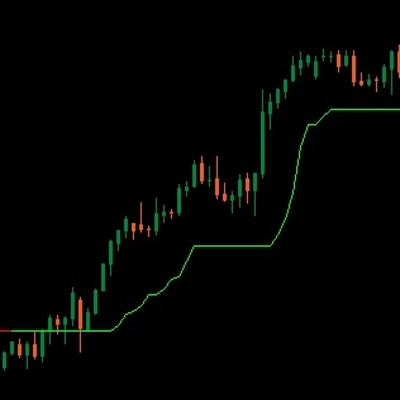
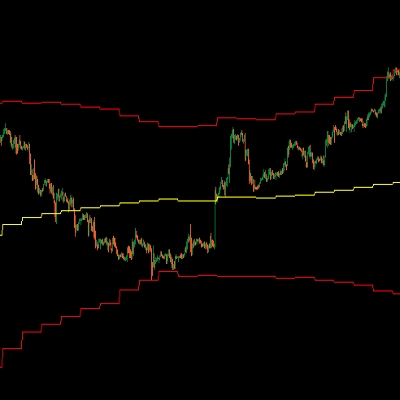
시그마 채널은 이동 평균과 표준 편차(σ)를 기반으로 하는 적응형 가격 채널을 그립니다. 이 채널은 시장 변동성에 따라 자동으로 확장 및 축소됩니다.
### 사용 방법
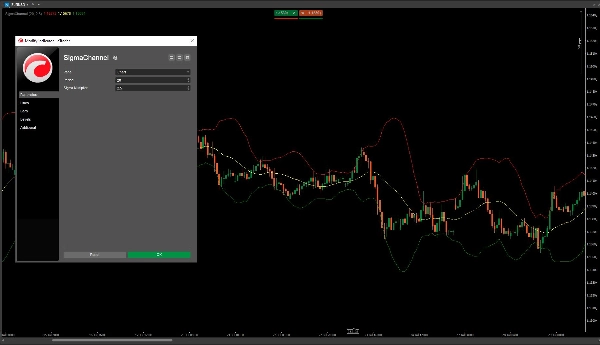
* **기간**: 계산에 사용되는 바의 수.
* **시그마 배수**: 채널 너비, 예: 2.0, 2.5 또는 3.0.
* **중간선**: 이동 평균.
* **상단/하단**: 이동 평균에서 선택된 σ 거리.
평균 회귀를 위해 가격이 외부 밴드에 도달하거나 이를 초과하는지 관찰하고 진입 전에 추가 확인을 사용하세요. 중간선은 잠재적 목표로 사용할 수 있습니다.
요약
AI summary
SigmaChannel is an adaptive volatility indicator that plots a dynamic price channel based on a moving average and standard deviation (σ). The channel width automatically adjusts to market volatility by expanding and contracting in response to price fluctuations. Key parameters include the period (number of bars used for calculation), sigma multiplier (defining channel width, e.g., 2.0, 2.5, or 3.0), and the moving average type for the middle line. The upper and lower bands represent selected standard deviation distances from the moving average. Traders can use SigmaChannel to identify potential mean-reversion opportunities when price reaches or exceeds the outer bands, with the middle line serving as a possible target. The indicator supports visualization and provides signals related to volatility regimes and reversals. It is designed for use with bar data and integrates concepts from Bollinger Bands, moving averages, and price channels.
지표 프로필
지표 카테고리
변동성
출력 유형
시각화
신호
데이터 요구 사항
막대만
지원되는 신호
반전
변동성
고객 리뷰
0.0
리뷰: 0
고객 리뷰
이 상품에 대한 리뷰가 아직 없습니다. 이미 사용해 보셨나요? 다른 사람들에게 가장 먼저 소개해 주세요!
상담
자주 묻는 질문(FAQ)
Bollinger Bands
Imbalance
Channel
Moving Average
트레이딩 봇, 지표, 플러그인 등 cTrader Store에서 제공되는 상품은 제3자 개발자에 의해 제공되며, 이는 단순히 정보 및 기술적 접근을 목적으로 제공된 것입니다. cTrader Store는 중개인이 아니며, 투자 조언, 개인별 추천 또는 향후 성과에 대한 어떠한 보장도 제공하지 않습니다.








가격
가입일 03/01/2025
638.03K
거래량
21.34K
핍 수익
19
판매