present
Regístrese y obtenga 50 $ de descuento en su primera compra
Trading product for Session Volume Profile London NY Indicador Key Levels Volume, image 1
Session Volume Profile London NY
Indicador
1 descargas
Versión 1.0, Oct 2026
Windows, Mac
Trading product for Session Volume Profile London NY Indicador Key Levels Volume, image 2
Trading product for Session Volume Profile London NY Indicador Key Levels Volume, image 3
353.2M
Volumen operado
2.78K
Pips ganados
32
Instalaciones gratis

Descripción

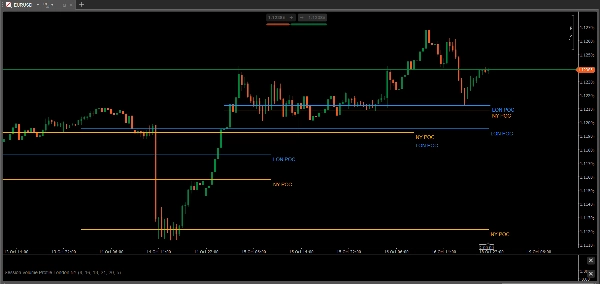
Session Volume Profile London NY displays the Point of Control (POC) for the London and New York sessions.


How it works:

- Calculates volume profile based on Tick Volume for each session

- London session: 08:00 - 16:00 UTC (adjustable)

- New York session: 13:00 - 21:00 UTC (adjustable)

- Draws POC as a horizontal trend line for the last 5 days

- Rows parameter controls profile resolution


Parameters:

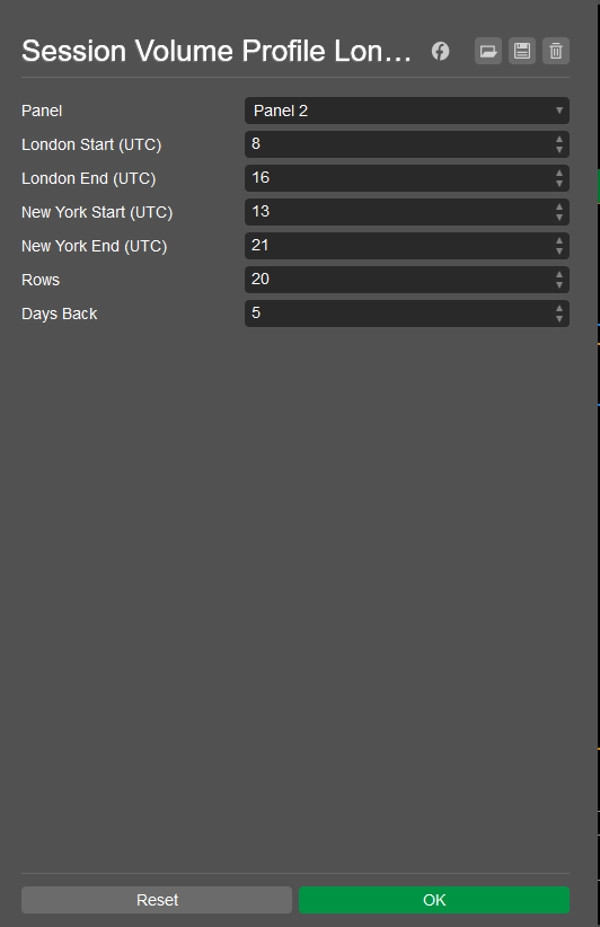
- London Start / End (UTC)

- New York Start / End (UTC)

- Rows (10-100, default 20)

- Days Back (1-30, default 5)


Use:

POC levels are often used as intraday support and resistance. Blue lines = London POC, Orange lines = New York POC.


This indicator is for informational purposes only. It does not provide financial advice or guarantee future results.

Resumen

AI summary
Session Volume Profile London NY is a trading indicator that calculates and displays the Point of Control (POC) levels for the London and New York trading sessions. It uses tick volume data to generate volume profiles for each session, with default time ranges of 08:00–16:00 UTC for London and 13:00–21:00 UTC for New York, both adjustable by the user. The indicator plots horizontal trend lines representing the POC for the last five days, with customizable parameters including session start/end times, profile resolution (rows), and the number of days back to display (1–30). The POC levels are visualized as blue lines for the London session and orange lines for the New York session, serving as potential intraday support and resistance levels. This tool provides volume-based key levels to assist traders in market structure analysis.
Perfil del indicador
Categoría del indicador
Volumen
Tipo de resultado
Visualización
Requisitos de datos
Únicamente barras
Volumen
Señales admitidas
Toque de nivel
Ruptura de nivel
Rango en la apertura de la sesión

Valoraciones de clientes

0.0
Valoraciones: 0
Valoraciones de clientes
Este producto todavía no se ha valorado. ¿Ya lo ha probado? Sea el primero en informar a otros.

Conversación

Preguntas frecuentes

Key Levels
Volume
Support & Resistance
Los productos disponibles a través de cTrader Store, incluidos bots, indicadores y plugins para operar, son proporcionados por desarrolladores de terceros y están disponibles únicamente con fines informativos y de acceso técnico. cTrader Store no es un bróker, por lo que no proporciona asesoramiento de inversión, recomendaciones personales ni ninguna garantía de rentabilidad futura.

Más de este autor
Indicador
Fair Value Gap
Liquidity Sweep
Stop trading fake FVGs. Shows FVG ONLY after PDH/PDL Liquidity Sweep. SMC - No Repaint, Cloud Safe.
Indicador
Drawdown Monitor
Protect your funded account. Real-time Daily Equity Drawdown monitor with Green / Orange / Red flashing alerts.
cBot
Prop Firm Fit
Spread Filter
+1
News risk controller. Auto-pauses trading around high-impact events with customizable filters.
cBot
Break Even
Low Drawdown
+1
EURUSD H1 trend bot, 5-year test, 3.87% equity DD, PF 2.01, no martingale
2.01
Factor de beneficio
Indicador
Fair Value Gap
Liquidity Grab
+2
PRO Liquidity Sweep + FVG Combo detector with custom Gold/Blue signals & alerts
cBot
ATR
Prop Firm Fit
Advanced volatility filter. Automatically pauses trading around important economic news events.

Puede interesarle

Indicador
Key Levels
Support & Resistance
Clean psychological round-number grid with native pip and point auto-scaling across Forex, Gold, Indices, and Crypto.
Indicador
Forex
Crypto
+3
28-method MA library in one indicator — from classic EMAs to adaptive & zero-lag variants.
Indicador
Volume
Order Block
+4
Volume Profile with fixed period, custom range and buy/sell pressure.
Indicador
Forex
Crypto
+4
Auto Trend Line Indicator for cTrader
Indicador
Volume
Custom range volume profile between two draggable anchors. Auto source timeframe, Total/Up-Down/Delta, POC, Value Area.
Indicador
ADX
ATR
+5
Identifies TRENDING, RANGING and VOLATILE markets with pullback detection. Anti-noise filter. Works on ANY chart.
Indicador
TraderMax BB Filter X (DEMO) for cTrader 🧪 Limited-Time Demo Version (24h) TraderMax BB Filter X (DEMO) is a precision
Indicador
ADX
ATR
+2
Detects market regime - Optimized for BTC/USD - with adaptive EMAs, Hurst, ADX & confidence score.
Indicador
Key Levels
Chart UI Tools
+2
Visualize five major market sessions in GMT with editable times, high-low boxes and directional range lines.
Indicador
Forex
BTCUSD
+11
Master trends with Smart ADX: MTF Scanner, precise Buy/Sell signals, Divergence & clear Exit targets 🎯
Indicador
ATR
Forex
+5
Most used candle patterns. (1 candle, 2 candles and 3 candles patterns) and Marubozu. Bonus Fibo Risk control.
Indicador
Indices
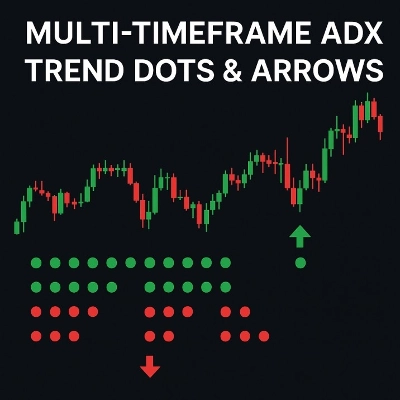
Multi-Timeframe ADX Trend Dots & Arrows
Indicador
Boost your trading with Candlestick Patterns for cTrader – auto-detect key signals for smarter, faster decisions!
Indicador
Risk Dashboard
AI-powered daily range forecasts help traders spot volatility opportunities and plan stops and targets.
Indicador
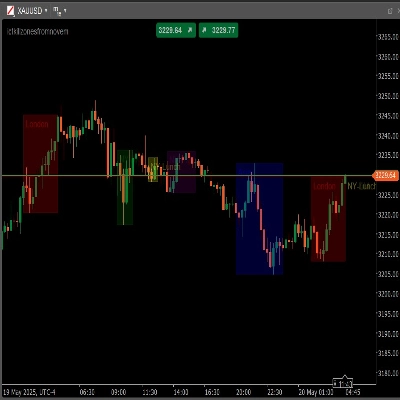
ICT ALL KİLL ZONES, LONDON , ASİA, NY AM, NY LUNCH, NY PM
Indicador
Forex
Crypto
+3
Day of Week Indicator for cTrader
Indicador
ATR
Volume
+2
Heatmap Liquidity Zones Visualize volume-at-price, uncover hidden support/resistance, and track market liquidity in real

Precio

353.2M
Volumen operado
2.78K
Pips ganados
32
Instalaciones gratis