Description
Ce qu'il analyse
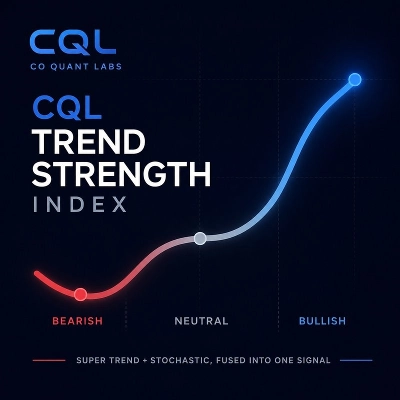
L'indice de force de tendance CQL combine Supertrend et Stochastique en un seul signal unifié au lieu de les exécuter comme deux outils séparés sur votre graphique. Il lit la direction du prix ainsi que le momentum et classe les conditions actuelles du marché en l'un des trois états : Achat Fort, Vente Forte ou Marché Latéral.
Comment interpréter le signal
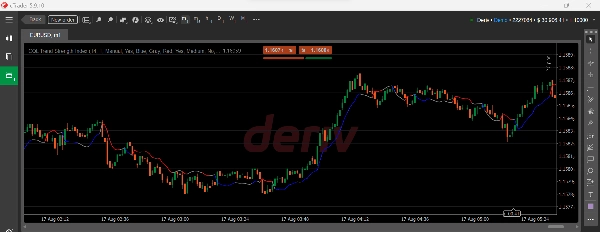
L'indicateur trace une seule ligne lissée directement sur le prix. Sa couleur vous dit tout en un coup d'œil :
- Le bleu signifie Achat Fort. Le prix et le momentum confirment tous deux une forte tendance haussière.
- Le rouge signifie Vente Forte. Le prix et le momentum confirment tous deux une forte tendance baissière.
- Le gris signifie Marché Latéral. Le momentum se situe dans une zone neutre, signalant une faible conviction quel que soit la direction du prix.
C'est un outil de contexte de tendance, pas un générateur de signal d'entrée. Il vous indique le caractère du marché actuel afin que vous puissiez appliquer votre propre méthode d'entrée avec une meilleure conscience de si vous tradez avec une forte tendance ou dans un marché latéral.
Paramètres clés et réglages
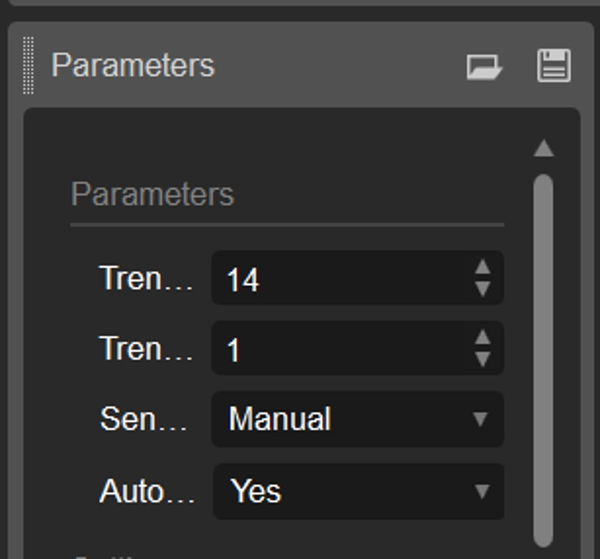
- La période de tendance et la réactivité de la tendance vous donnent un contrôle total sur la rapidité de réponse de l'indicateur
- Le préréglage de sensibilité (Lent, Moyen, Rapide, Manuel) vous permet de l'ajuster rapidement sans toucher aux chiffres bruts
- L'adaptation automatique au timeframe ajuste la sensibilité automatiquement en fonction de votre graphique
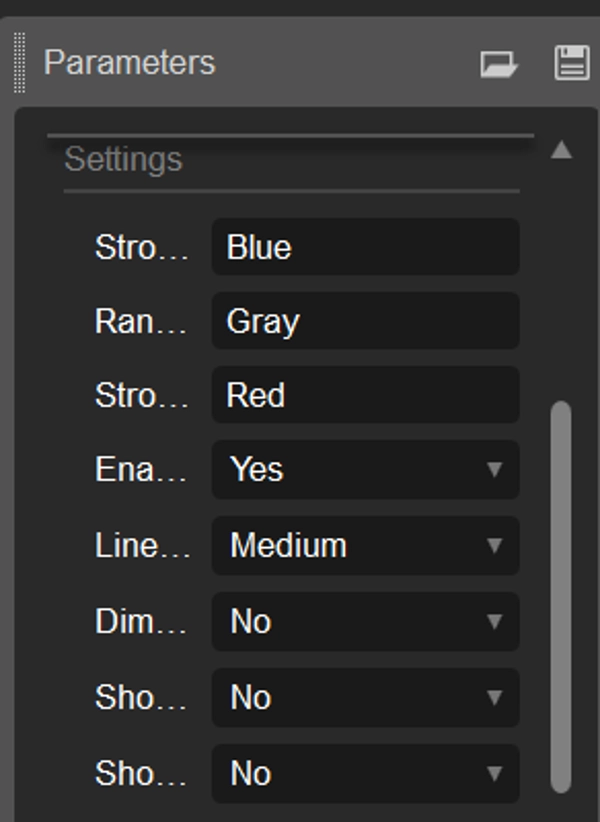
- L'onglet des réglages couvre la personnalisation complète des couleurs, l'épaisseur des lignes, les étiquettes d'état, la teinte de la zone de fond et une option de réinitialisation par défaut
Cas d'utilisation typiques
- Confirmer rapidement si un marché est fortement en tendance avant de chercher des entrées avec un autre outil ou méthode
- Filtrer les conditions de marché latéral ou choppy où les stratégies de suivi de tendance sous-performent généralement
- Obtenir une lecture visuelle rapide de la santé de la tendance sans interpréter deux indicateurs séparés
Pour qui c'est
Les traders qui ont déjà une méthode d'entrée, manuelle ou automatisée, et veulent un filtre de contexte de tendance rapide et fiable superposé. Convient aux swing traders discrétionnaires ainsi qu'à ceux qui construisent des systèmes basés sur des règles et qui ont besoin d'une classification claire tendance versus absence de tendance.
Limitations et notes d'utilisation
- C'est un indicateur de contexte de tendance, pas un signal d'entrée d'achat ou de vente. Il ne prédit pas les retournements ni ne génère d'entrées de trade
- Comme tous les outils de suivi de tendance, il accuse un retard au début d'une nouvelle tendance et peut rester en Marché Latéral lors de cassures à faible momentum
- À utiliser de préférence avec votre propre gestion des risques et confirmation d'entrée, pas comme un système de trading autonome
Résumé
Key features include adjustable Trend Period and Reactivity settings, sensitivity presets (Slow, Medium, Fast, Manual), and automatic adaptation to the chart’s timeframe. Users can customize colors, line thickness, labels, and background zone tinting. Typical use cases involve confirming strong trends before applying entry methods, filtering out ranging conditions where trend-following strategies may underperform, and obtaining a clear visual read of trend health without managing multiple indicators.
Designed for traders with existing entry strategies, it supports discretionary and rule-based trading by providing a reliable trend versus no-trend classification. The indicator requires integration with personal risk management and entry confirmation techniques and is intended for use across various markets where price bars are available.
Discussion
Avis clients
5 | 100 % | |
4 | 0 % | |
3 | 0 % | |
2 | 0 % | |
1 | 0 % |