
Description
Indicateur Avancé des Zones Donchian pour cTrader
Maîtrisez les Tendances du Marché & les Cassures avec Précision !
Passez votre trading au niveau supérieur avec l’Indicateur Avancé des Zones Donchian – un outil puissant conçu pour les traders exigeant précision, flexibilité et efficacité. Cet indicateur de nouvelle génération améliore les Canaux Donchian classiques en introduisant l’analyse multi-échelles temporelles, des calculs de prix personnalisables, des alertes en temps réel, et une visualisation en nuage.
Que vous tradiez le forex, les actions ou les matières premières, l’Indicateur Avancé des Zones Donchian vous équipe des outils pour identifier les cassures, suivre les tendances et trader les retournements comme un pro.
Caractéristiques Clés & Avantages :
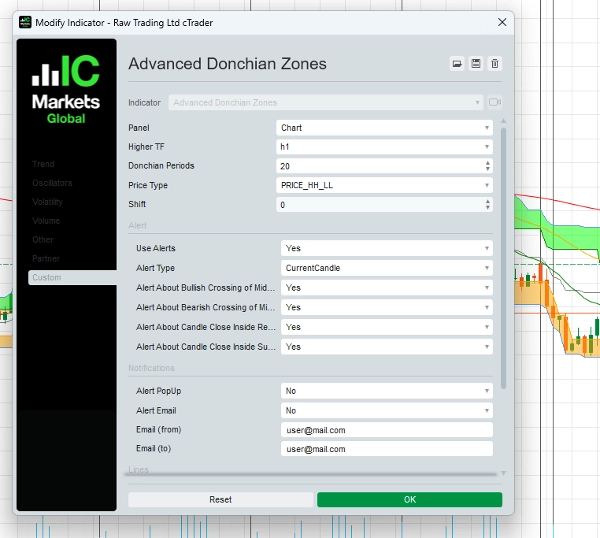
1. Zones Donchian Multi-Échelles
- Analysez les Zones Donchian depuis une échelle temporelle supérieure tout en tradant sur une inférieure, garantissant une alignement constant avec la tendance de marché plus large.
- Idéal pour les day traders et swing traders cherchant à optimiser leurs entrées et sorties.
2. Calcul de Prix Personnalisable
- Choisissez parmi cinq types de prix avancés pour affiner votre stratégie :
-
- Plus Haut / Plus Bas
- Moyenne du Haut/Ouverture ou Haut/Fermeture
- Ouverture la Plus Haute / Ouverture la Plus Basse
- Fermeture la Plus Haute / Fermeture la Plus Basse
- Adaptez l’indicateur à votre style de trading et gestion des risques.
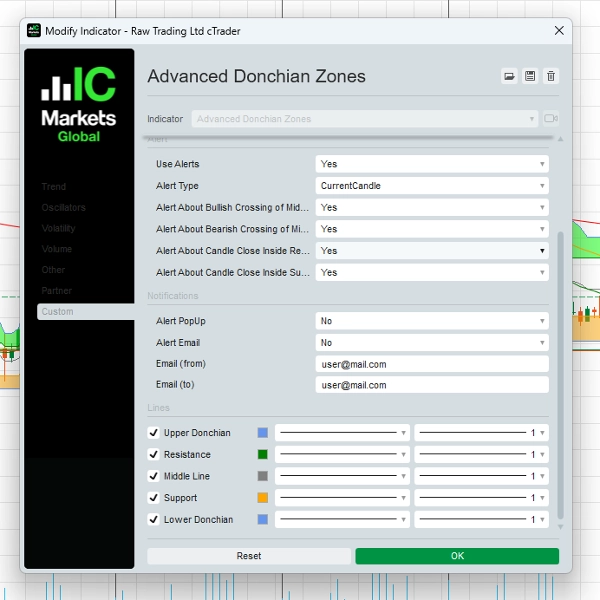
3. Alertes Dynamiques – Ne Ratez Jamais une Opportunité !
- Recevez des notifications en temps réel lors d’événements clés de trading :
-
- Croisements de la Ligne Médiane (signaux haussiers ou baissiers)
- Fermeture des Prix à l’Intérieur des Zones Clés (zones potentielles de retournement ou de cassure)
- Alertes disponibles via pop-ups et email, vous gardant en avance sur les mouvements du marché.
4. Visualisation en Nuage pour des Insights Clairs
- Des zones ombrées uniques entre les niveaux Donchian aident les traders à identifier visuellement les zones de support, résistance et de cassure rapidement et efficacement.
5. Paramètre de Décalage Flexible
- Ajustez le positionnement des Zones Donchian en avant ou en arrière dans le temps pour affiner votre stratégie de trading.
6. Interface Facile à Utiliser
- Conçu pour les traders de tous niveaux, avec une disposition intuitive et des réglages personnalisables pour correspondre à vos préférences de trading.
Comment Utiliser l’Indicateur Avancé des Zones Donchian
1. Stratégie de Trading sur Cassure – Capturez des Mouvements Explosifs !
- Configuration :
-
- Appliquez l’Indicateur Avancé des Zones Donchian à votre graphique.
- Sélectionnez une période Donchian (ex. : 20) et une échelle temporelle supérieure (ex. : 1H ou 4H) pour des signaux plus précis.
- Entrée :
-
- Achetez lorsque le prix casse et clôture au-dessus de la zone Donchian supérieure.
- Vendez lorsque le prix casse et clôture en dessous de la zone Donchian inférieure.
- Sortie :
-
- Utilisez la ligne médiane ou la zone Donchian opposée comme niveau de sortie.
- Exemple :
-
- Si vous tradez un graphique de 15 minutes, réglez le calcul Donchian sur une échelle temporelle de 1 heure. Lorsque le prix casse au-dessus du niveau Donchian supérieur, entrez un trade d’achat avec un stop-loss proche de la ligne médiane.
2. Stratégie de Suivi de Tendance – Surfez sur l’Impulsion du Marché
- Configuration :
-
- Utilisez la ligne médiane comme filtre de tendance.
- Tradez uniquement dans la direction de la tendance dominante.
- Entrée :
-
- Achetez lorsque le prix est au-dessus de la ligne médiane et rebondit sur la zone de support.
- Vendez lorsque le prix est en dessous de la ligne médiane et rebondit sur la zone de résistance.
- Sortie :
-
- Fermez le trade lorsque le prix traverse la ligne médiane dans la direction opposée.
- Exemple :
-
- Sur un graphique de 4 heures, le prix reste au-dessus de la ligne médiane, confirmant une tendance haussière. Entrez un trade d’achat lorsque le prix revient vers la zone de support et montre des signes de retournement.
3. Stratégie de Trading en Range – Profitez des Marchés Latéraux
- Configuration :
-
- Identifiez les périodes où le prix fluctue entre les zones Donchian supérieure et inférieure.
- Entrée :
-
- Achetez lorsque le prix approche le support.
- Vendez lorsque le prix approche la résistance.
- Sortie :
-
- Prenez vos profits près de la zone Donchian opposée ou lorsqu’une cassure se produit.
- Exemple :
-
- Sur un graphique d’1 heure, si le prix oscille entre les niveaux Donchian supérieur et inférieur, exécutez des trades à ces extrêmes pour des opportunités de retour à la moyenne.
Pourquoi les Traders Choisissent les Zones Donchian Avancées
✔ Polyvalent pour Différents Styles de Trading – Fonctionne pour les cassures, le suivi de tendance et le trading en range.
✔ Améliore la Précision du Trading – Identifiez avec précision les niveaux clés de support & résistance.
✔ Alertes en Temps Réel – Restez informé grâce à des notifications instantanées.
✔ Outil de Niveau Professionnel – Développé pour les traders cherchant un avantage sur le marché.
Tarification & Offre Exclusive
Prix Spécial Limité dans le Temps : 97 $ (Paiement Unique)
Comprend :
- Indicateur Avancé des Zones Donchian pour cTrader
- Guide Utilisateur Complet avec des stratégies étape par étape
- Mises à Jour Gratuites pendant 1 an
- Support Email Prioritaire
Ce Que Disent les Traders
« J’utilise les Canaux Donchian depuis des années, mais cet indicateur passe à un autre niveau. La fonction multi-échelles temporelles change la donne ! »
— Mark S., Trader Forex
« Les alertes et les réglages de prix personnalisables m’aident à saisir les trades de cassure avec plus de confiance. Fortement recommandé pour les traders sérieux. »
— Lisa T., Swing Trader
Commencez Dès Aujourd’hui !
Prêt à transformer votre trading ? Cliquez sur le bouton ci-dessous pour acheter l’Indicateur Avancé des Zones Donchian et commencez à trader avec précision !
[Acheter Maintenant pour 97 $]
Garantie de Remboursement de 30 Jours
Nous soutenons notre produit. Si vous n’êtes pas entièrement satisfait, contactez-nous dans les 30 jours pour un remboursement complet – sans poser de questions.
Besoin d’Aide ? Contactez-Nous !
📧 Email : o.elmottaqy@gmail.com
🌐 Site Web : https://t.me/mottaqyo
Avertissement sur les Risques
Le trading comporte des risques. L’Indicateur Avancé des Zones Donchian est un outil pour aider vos décisions de trading mais ne garantit pas de profits. Utilisez toujours une gestion des risques appropriée et tradez de manière responsable.
Résumé
Key functionalities include real-time alerts via pop-ups and email for significant events such as midline crossovers and price closing inside key zones, helping traders stay informed of potential breakouts or reversals. A unique cloud visualization feature shades zones between Donchian levels to clearly identify support, resistance, and breakout areas. The flexible shift parameter allows users to adjust the positioning of Donchian Zones forward or backward in time for strategy fine-tuning.
Suitable for forex, stocks, and commodities markets, this indicator supports multiple trading strategies including breakout, trend-following, and range-bound trading. It features an intuitive interface designed for traders of all levels. The product includes a comprehensive user guide with step-by-step strategies, free updates for one year, and priority email support.
Avis clients
5 | 50 % | |
4 | 50 % | |
3 | 0 % | |
2 | 0 % | |
1 | 0 % |


