Descrição
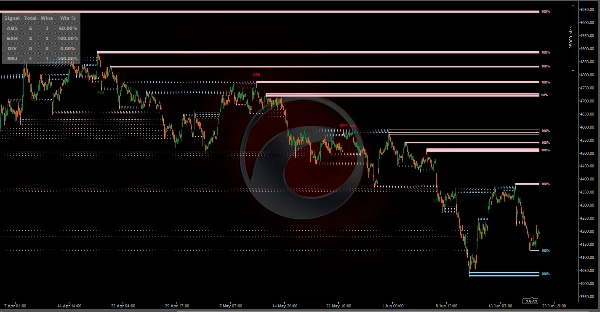
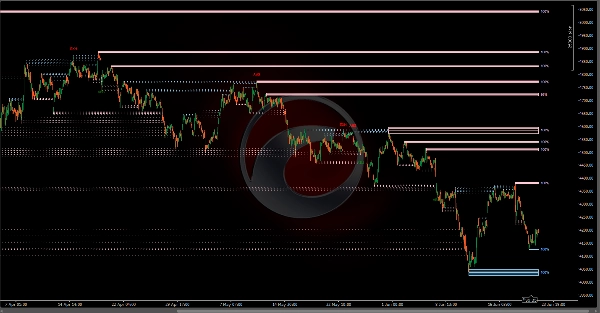
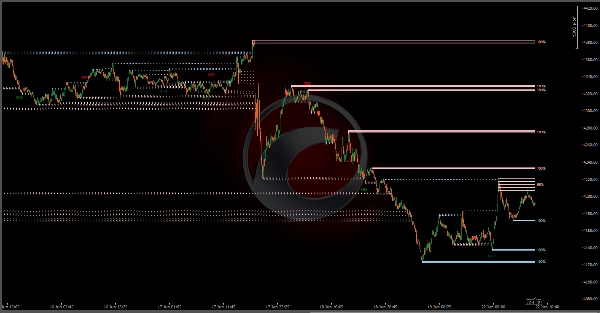
A Ferramenta Liquidity Profiler é um indicador que identifica os principais níveis de liquidez do lado comprador e vendedor e visualiza a atividade interna de compradores/vendedores através de quadrantes preenchidos por delta de volume, fornecendo um conjunto completo de ferramentas para analisar varreduras de liquidez e potenciais reversões.
Detecção
O indicador utiliza um sistema de detecção baseado em pivôs. Quando uma máxima de oscilação é confirmada, uma zona de Liquidez do Lado Comprador (BSL) é criada; uma mínima de oscilação cria uma zona de Liquidez do Lado Vendedor (SSL). O script inclui a lógica "Filtrar Sobreposições" para garantir a clareza do gráfico. Se um novo pivô mais significativo se formar dentro do alcance de uma zona ativa existente, a ferramenta pode atualizar automaticamente para o nível mais relevante, evitando a confusão de múltiplas caixas sobrepostas.
Esta ferramenta divide cada zona em quatro quadrantes horizontais. Conforme o preço negocia dentro desses quadrantes, o script calcula o delta de volume (a diferença entre a pressão de compra e venda) para cada seção específica.
Zonas de Compra: Indica que compradores agressivos estiveram mais ativos naquela fatia específica de preço.
Zonas de Venda: Indica que vendedores agressivos dominaram aquela seção.
Detecção de Reversão
O script inclui um sistema de detecção que identifica padrões incomuns de volume durante varreduras de liquidez. Esses sinais são exibidos como texto da seguinte forma:
-
- ABS (Absorção): Ocorre quando ordens agressivas de mercado na borda extrema de uma zona são absorvidas por grandes ordens limitadas na direção oposta.
- EXH (Exaustão): Ocorre quando uma varredura acontece com volume relativo muito baixo, sugerindo ausência de continuidade.
- DIV (Divergência): Identificada quando alto volume empurra para a borda de uma zona (FOMO), mas o preço não consegue fechar fora do nível.
- REJ (Rejeição de Retorno): Disparada quando uma vela de varredura mostra delta alto na direção oposta à varredura e fecha novamente dentro da zona.
Painel de Controle:
O indicador inclui um painel em tempo real que acompanha o desempenho histórico de cada tipo de sinal de reversão usando uma lógica de validação baseada no tempo.
Vitória registrada se dentro da Janela de Avaliação, o preço reverte da varredura e permanece em lucro (do lado correto da entrada do sinal) por um número específico de barras consecutivas (Tempo de Retenção).
Decaimento da Zona (Saúde):
Zonas ativas apresentam um rótulo de porcentagem de "Saúde". Isso acompanha o volume acumulado negociado dentro da zona em relação à sua capacidade. À medida que mais volume é transacionado nesses níveis, a liquidez é considerada "consumida" e a porcentagem cai em direção a 0%.
Configurações do Indicador
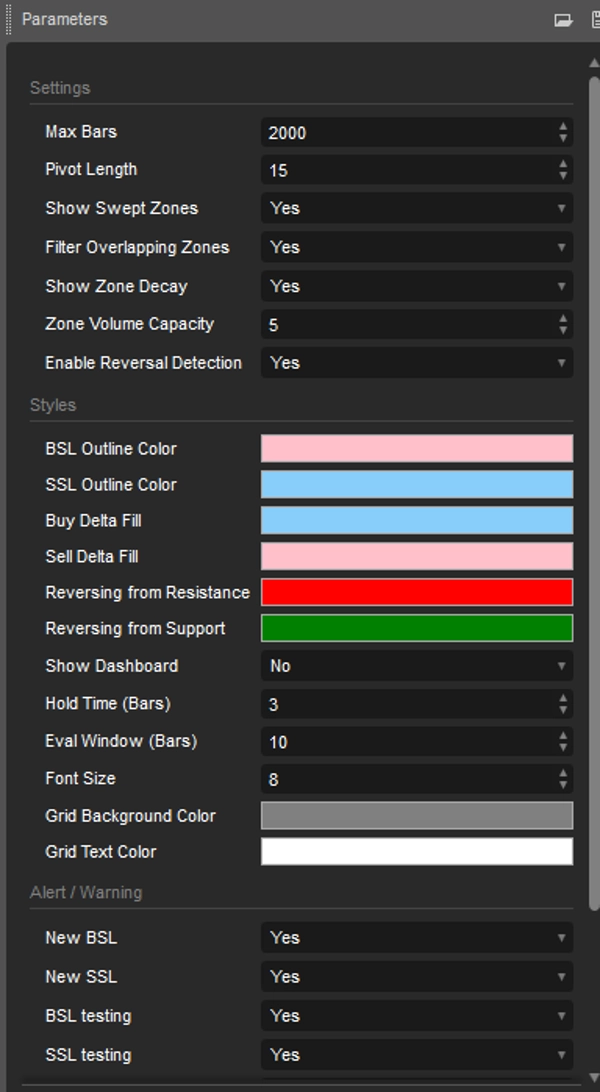
Configurações
- Comprimento do Pivô: Período de retrocesso/avanço para detectar máximas e mínimas de oscilação.
- Máximo de Barras: O indicador começa a calcular com base no número de velas históricas.
- Mostrar Zonas Varredas: Mantém as zonas visíveis com contornos tracejados após terem sido rompidas.
- Filtrar Zonas Sobrepostas: Evita a criação de novas zonas que se sobreponham às zonas ativas existentes.
Decaimento & Reversões
- Mostrar Decaimento da Zona: Alterna os rótulos de porcentagem de saúde.
- Capacidade de Volume da Zona: Multiplicador para o volume médio para determinar quanto volume uma zona pode absorver.
- Ativar Detecção de Reversão: Alterna as bolhas de sinal para padrões de reversão.
Painel de Controle
- Mostrar Painel: Alterna a tabela de acompanhamento de desempenho.
- Tempo de Retenção (Barras): Número de barras consecutivas que o preço deve permanecer em lucro para ser considerada uma reversão bem-sucedida.
- Janela de Avaliação (Barras): Número máximo de barras que o script espera para que uma reversão se manifeste.
Estilos e Alerta
- Estilos: Ajusta a configuração de cor dos objetos. Ocultar/Mostrar Painel.
- Alerta: Ativa/desativa alertas sempre que BSL&SSL é detectado/migrado/testado/reversão.
Resumo
The tool also detects potential reversal signals during liquidity sweeps, displaying four types of volume-based patterns: Absorption (ABS), Exhaustion (EXH), Divergence (DIV), and Snapback Rejection (REJ). These signals help identify unusual volume behavior that may precede price reversals.
A real-time dashboard tracks the historical performance of reversal signals, validating them based on price action within a user-defined evaluation window and hold time. Active zones feature a "Health" metric indicating the extent of volume consumed relative to zone capacity, reflecting liquidity depletion.
Users can customize settings including pivot length, volume capacity, zone visibility, reversal detection toggles, and dashboard display. The indicator supports visualization of liquidity sweeps and reversals, aiding analysis of support and resistance levels through volume and order flow insights.