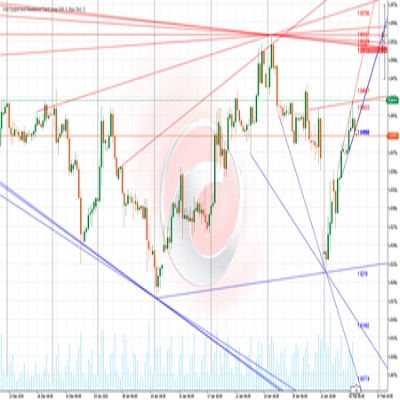
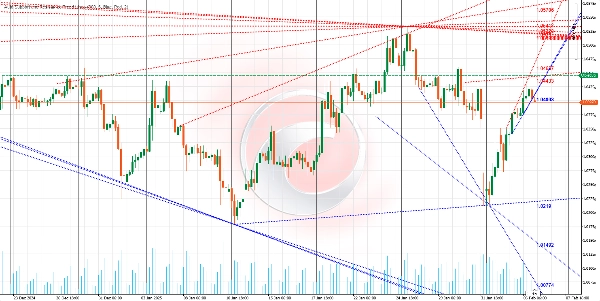
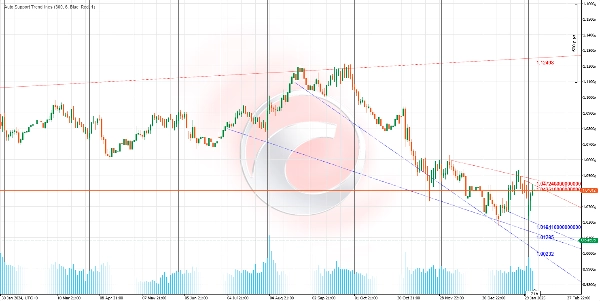
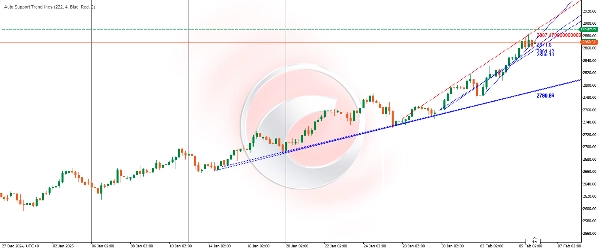
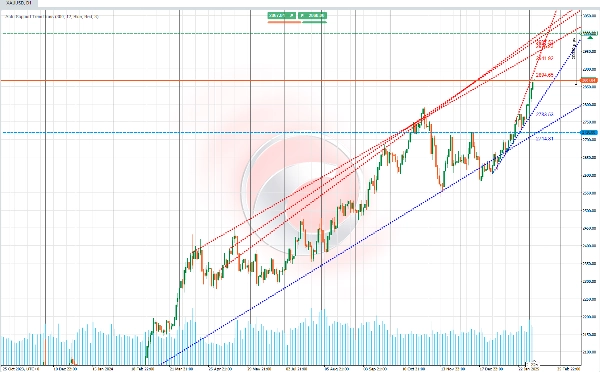
Auto Support and Resistance Trend Lines
Indicador
Versión 1.0, Feb 2025
Windows, Mac
Perfil del indicador
0.0
Valoraciones: 0
Valoraciones de clientes
Este producto todavía no se ha valorado. ¿Ya lo ha probado? Sea el primero en informar a otros.
Supertrend
RSI
Los productos disponibles a través de cTrader Store, incluidos bots, indicadores y plugins para operar, son proporcionados por desarrolladores de terceros y están disponibles únicamente con fines informativos y de acceso técnico. cTrader Store no es un bróker, por lo que no proporciona asesoramiento de inversión, recomendaciones personales ni ninguna garantía de rentabilidad futura.


Desde 03/10/2024
161
Ventas
37.49K
Instalaciones gratis