present
Sign up and get $50 off your first purchase
Trading product for Grid Visualization 2.0 Indicator Drawdown Monitor, image 1
Grid Visualization 2.0
Indicator
Version 1.0, Apr 2026
Windows, Mac
Trading product for Grid Visualization 2.0 Indicator Drawdown Monitor, image 2
Trading product for Grid Visualization 2.0 Indicator Drawdown Monitor, image 3
Trading product for Grid Visualization 2.0 Indicator Drawdown Monitor, image 4
33
Sales
1.01K
Free installs

Description


Interactive Grid & Martingale Planner (Drag & Drop)


Overview
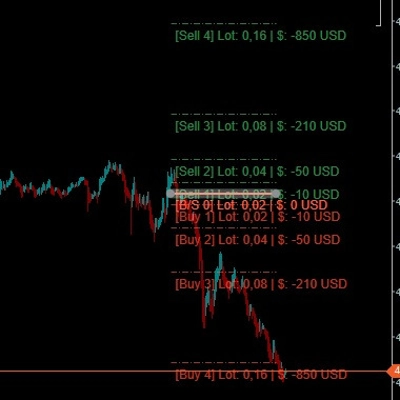
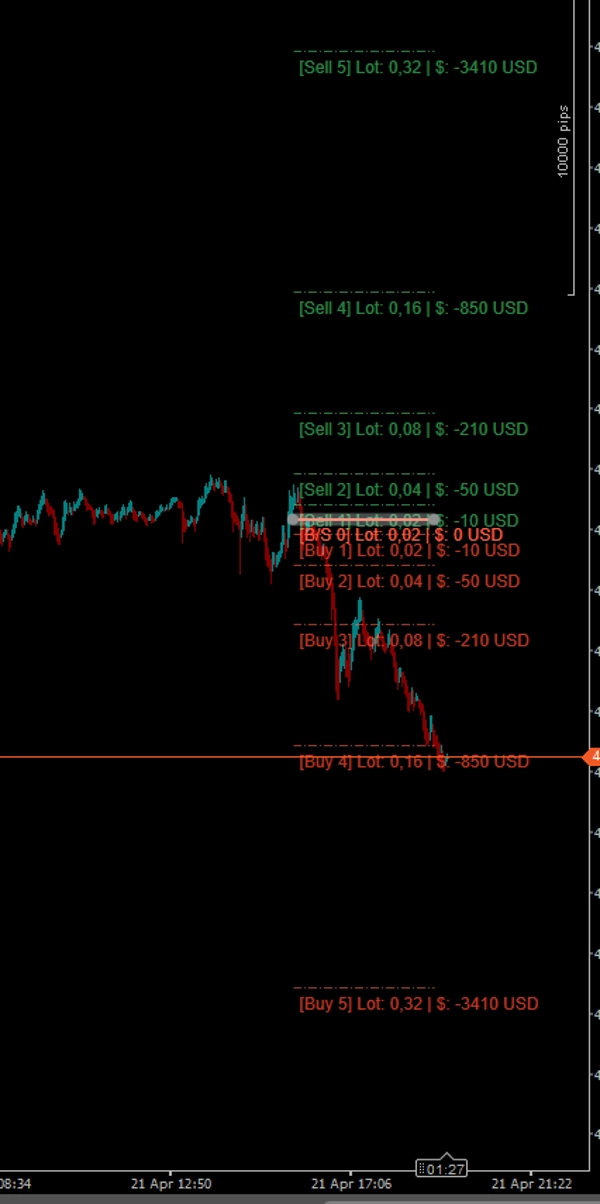
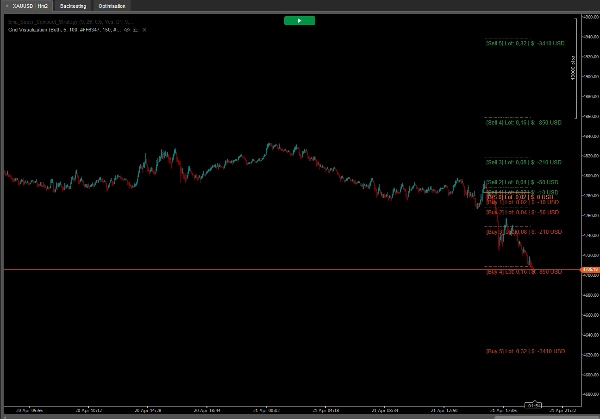
The Interactive Grid Planner is a powerful, free, and fully interactive visualizer for traders who utilize Grid, Recovery, or Martingale strategies. Instead of guessing your future drawdown or calculating position sizes manually, this indicator allows you to plot a potential grid directly on the chart and interact with it in real-time!

It calculates and displays the exact lot size and the cumulative Unrecognized PnL (in your account currency, e.g., $) for every future grid level based on your algorithmic parameters.

🔥 Key Features (The Magic):

  • Point & Click Creation: Hold CTRL and Left-Click anywhere on the chart. The grid will instantly spawn exactly at your mouse cursor's price level.
  • Drag & Drop Real-Time Updates: The main entry line (Level [0]) is fully interactive! Click and drag it up or down across the chart. The entire grid, including all pip distances and PnL calculations, will dynamically recalculate and follow your cursor in real-time!
  • Money-Based Spacing: Forget calculating pips manually. You set the distance based on your account currency (e.g., "Open the next grid level when my loss hits $10"). The indicator calculates the exact pip distance automatically for any asset.
  • Advanced Lot Progression: Choose how your position sizes scale. Supports Arithmetic Addition (e.g., 0.02, 0.04, 0.06) or traditional Multipliers. (Note: By design, the initial entry Level 0 and the first recovery Level 1 share the exact same starting lot size).
  • Custom Aesthetics: Full support for HEX color codes (e.g., #FF6347) or standard color names. It also features a custom Opacity parameter (0-255) to make grid lines transparent, keeping your charts clean.
  • One-Click Cleanup: Hold CTRL and Left-Click again to instantly clear the entire grid from your chart.

How to Use:

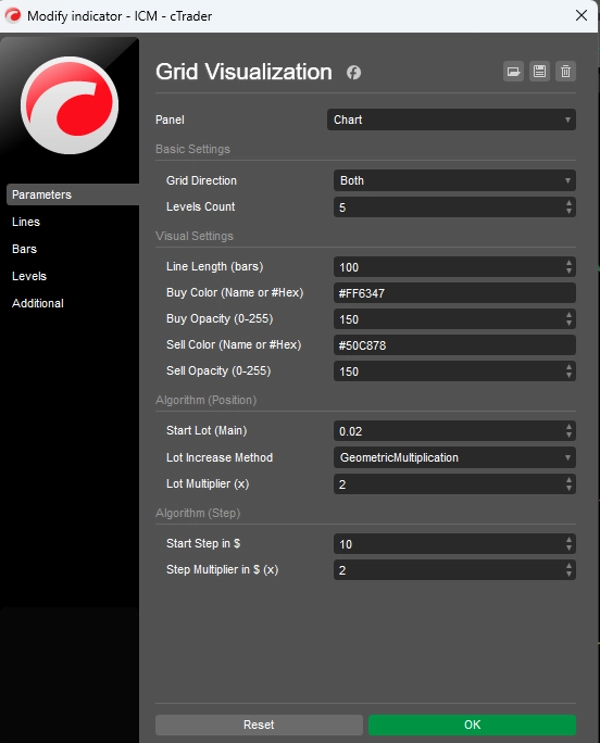
  1. Attach the indicator and set your algorithm rules (Starting Lot, Step value in $, Multipliers).
  2. Hover your mouse over the exact price level where you want to simulate your initial entry.
  3. Hold the CTRL key and Left-Click. The grid will appear.
  4. Grab the solid Main Line (Level 0) with your mouse and drag it around to easily explore different entry scenarios.
  5. To hide the grid, hold CTRL + Left-Click again.

Parameters:

  • Grid Direction: Display Buy levels (downwards), Sell levels (upwards), or Both simultaneously.
  • Visual Settings: Line length in bars, HEX Color inputs, and precise Opacity control.
  • Start Lot & Multiplier: Your base volume and the multiplier applied to subsequent recovery levels.
  • Start Step ($) & Step Multiplier: The monetary distance to the first recovery level, and how much that distance expands on further levels.

Perfect for manual traders planning a grid entry, or algorithmic developers visualizing their EA's logic before coding!


Summary

Indicator profile
Indicator category
Statistics
Output type
Visualisation
Data requirements
Bars only

Discussion

Customer reviews

0.0
Reviews: 0
Customer reviews
No reviews for this product yet. Already tried it? Be the first to tell others!

FAQ

Drawdown Monitor
Products available through cTrader Store, including trading bots, indicators and plugins, are provided by third-party developers and made available for informational and technical access purposes only. cTrader Store is not a broker and does not provide investment advice, personal recommendations or any guarantee of future performance.

More from this author

Indicator
AI
Prop
+8
The EMA Trend Simple is a trend-following tool designed for simplicity and visual clarity.
cBot
Prop Firm Fit
Stop Loss (SL) Manager
+1
HTS Strategy Tester - Advanced Multi-Timeframe Trend & Pullback Trading System H1/m1 & H4/m5 WWS 33/144 Start from 100$
90.1%
ROI
2.92
Profit factor
Indicator
AI
Grid
+7
Follow The Trend cBot - INDICATOR - displays two Moving Average Bands for cBot or for your own use
Indicator
AI
SMC
+7
The ultimate tool for Price Action and ICT. High, Low and Mid levels for days, weeks Inc. NY Midnight and Custom Range.
Indicator
Key Levels
TP_SL Very useful Risk & Reward Tool. Bring the ultimate TradingView-style Long/Short Position
Indicator
ATR
MACD
+15
MACD Advanced -- It combines the standard MACD logic with a rich set of visual tools
Indicator
ATR
Prop
+13
HCCC MTF (Hurst Cycle Composite Channel), Designed for Semi-Automated Trading, Interactive MTF Dashboard
Indicator
AI
RSI
+7
EMA MTF TREND PRO - Multi-timeframe trend analysis overlay indicator, 6 timeframes - in one table with ADX
Indicator
AI
Prop
+7
EMA Clouds, Multi-Timeframe (MTF) Overlay, Swing High/Low detection, and a smart Dashboard with neutral zone filtering.
Indicator
AI
SMC
+4
Weekly Daily Opening Gaps — NWOG & NDOG Indicator Professional-grade opening gap visualization for institutional traders
Indicator
ATR
Channel
+1
Bollinger Bands Advanced Squeeze & Breakout System, Real-Time On-Chart Dashboard, Auto-Squeeze Detector, Dual-Band Cloud
Indicator
AI
ATR
+12
The standard Relative Strength Index (RSI), RSI & Signal Cloud, Smart Volatility Filter (ATR), On-Chart Info Dashboard

You may also like

Indicator
Forex
BTCUSD
+5
SMA Cross Signal – Simple Moving Average Crossover with Visual Alerts (FREE)
Indicator
ATR
EMA
+5
Candle timer with live profit tracking on chart – displays pips, currency value, and percentage in real time.
Indicator
Signal
🔹 Trend-Reversal-Indicator for cTrader 🔹 The ultimate Renko chart tool!
Indicator
Forex
EURUSD
+5
Fimathe Indicator - Fimathe PCM - Automated Trend Channels & Levels — Ideal for live trading and backteting
Indicator
VWAP
Support & Resistance
Trading.FC$_vwap Algo shows VWAP trends, dynamic support/resistance and deviation bands to spot potential trade entries.
Indicator
Prop
Forex
+5
Traders Panel: Scan 15 pairs across 5 timeframes. Live heatmap, strength rankings and best setups in one panel.
Indicator
Forex
Crypto
+3
Perfect Trend
Indicator
SMA
Volume
+3
Stoc​h PRO Quad Rotation Signal (QRS) is an advanced technical analysis indicator developed for cTrader.
Indicator
Forex
Crypto
+3
Detect powerful 2-candle reversal patterns at key highs/lows. Boost entries with real-time alerts and visual signals.
Indicator
Prop
E7 BBKG indicator with 80% plus accuracy used to show both, possible reversal and trend.
Indicator
Volume
Order Block
+3
Map market structure, order blocks, liquidity and key zones with an interactive cTrader dashboard.
Indicator
BTCUSD
EURUSD
+8
Price Projection Swing Volume maps future paths using swing pivots and Fibonacci ratios. Visual, geometric and precise.!
Indicator
Signal
Trades Opening Range Breakouts Indicator with dynamic stops/targets adapting to market volatility.
Indicator
Forex
Crypto
+3
VSA indicator analyzing volume, spread, and close location to detect supply/demand imbalances.
Indicator
BOS
MSS
+3
Advanced indicator to highlight key execution context and help aligning structure, location, and risk.
Indicator
ATR
SMC
+15
Plot ATR-based SL and 1R/2R/3R TPs instantly for any trade, with clear R-multiple risk mapping.
Indicator
Doji
Wedge
+5
Angora Pattern Recognition is a cTrader indicator that finds, draws and tracks classic chart patterns automatically.
Indicator
Prop
VWAP
+5
Multi-anchor VWAP indicator for cTrader. Plots two VWAP lines (red and blue) with selectable anchors.

Price

33
Sales
1.01K
Free installs