もしあなたが外国為替市場で時間を過ごしたことがあるなら、特に複数の通貨ペアを見ているときに、どの通貨が本当に動きを牽引しているのかを見極めるのがどれほど難しいかご存知でしょう。私はしばしば、単に一つのペアの動きを見るだけでなく、主要通貨の個々のパフォーマンスをもっと明確に見たいと思っていました。
だからこそ、私はこの 相対通貨強度インジケーター を開発しました。
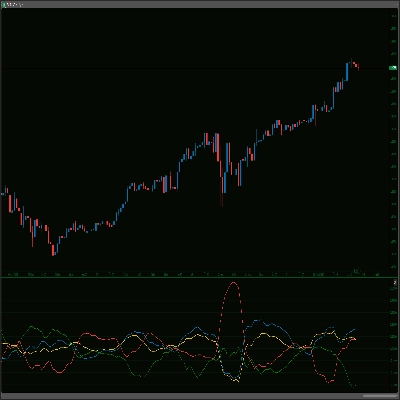
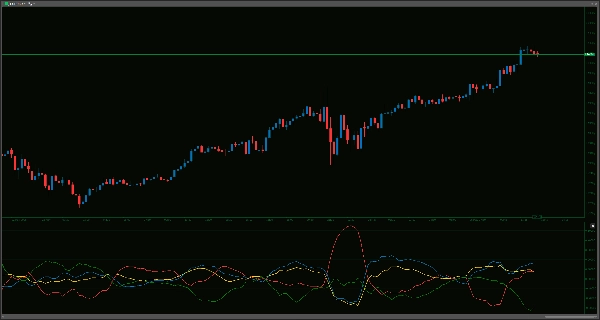
アイデアは非常にシンプルです:AUD、USD、EUR、JPYの相対的な強さを測定し表示することを目的としています。これは、これらの通貨が他の通貨のバスケット(具体的にはAUDUSD、AUDEUR、AUDJPY、EURUSD、EURJPY、USDJPYのようなペア)に対してどのようにパフォーマンスを示しているかを、あなたが定義できる遡及期間で見ています。
私がこれを役立ててきた方法、そしてあなたにも役立つかもしれない方法:
- より良いペア選択: 例えば、AUDが一貫して強くなり、JPYが弱くなっているのを見ると、AUD/JPYを詳しく見るきっかけになることがあります。注目するペアを絞り込むのに役立ちます。
- 市場の動因の理解: EUR/USDのようなペアが動くとき、それは主にUSDの強さによるものか、EURの弱さによるものか?このインジケーターはその視点を提供し、より広範な流れを理解するのに役立ちます。
- あなたのスタイルに合わせて調整:
-
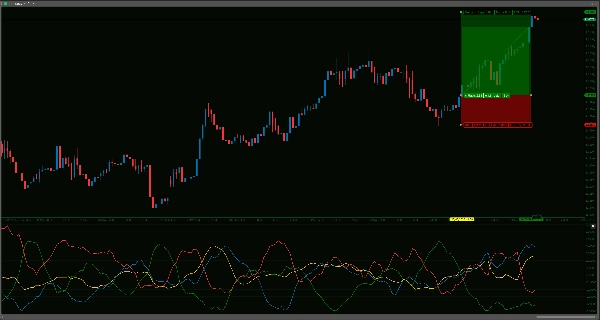
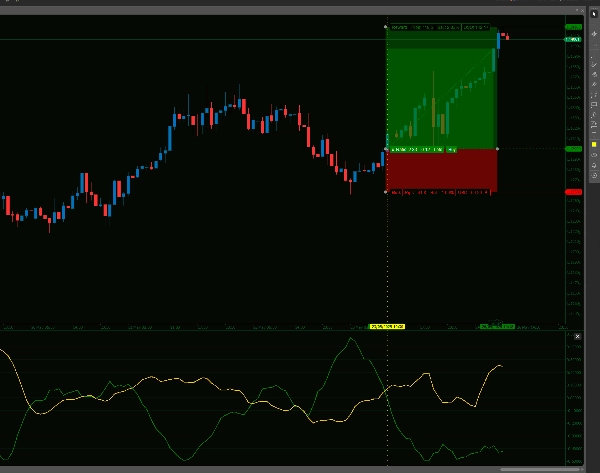
LookbackPeriod(デフォルトは14バー)を調整できます。短い期間はより反応が速く、長い期間はより確立されたトレンドを示します。- また、
SmoothingPeriod(デフォルトは5バー)もあり、強度ラインにEMAを適用します。これにより、より滑らかな出力を好む場合にノイズを減らすのに役立ちます。生の計算が欲しい場合は、スムージングを0に設定してください。
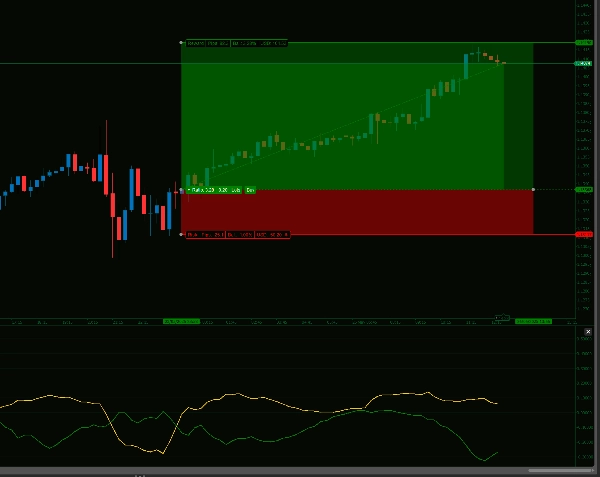
- 明確なビジュアル: 各通貨の強さをメインチャートの下の独立したウィンドウに別々のラインとしてプロットするため、価格の動きを邪魔しません。
- 信頼できるデータ: 計算は各バーの終値で行われるため、バーが完了するとラインは再描画や変更をしません。
どんなインジケーターも水晶玉ではなく、このインジケーターも例外ではありません。これはツールです。私はこれを分析プロセスの有用な一部として見つけており、特にアイデアの確認や主要通貨の動向を素早く把握するのに役立っています。
注意点として、このインジケーターは真の相対強度を効果的に計算するためにすべての通貨ペアのデータを取得しているため、他のリソースを多く消費するインジケーターを使用している場合、Ctraderが重くなったりクラッシュすることがあります。私の5年使っているPCでは過去1ヶ月で一度だけ発生しましたので、頻繁には起こらないはずです。しかしもし起こった場合は、ウィンドウの時間枠をリフレッシュするか、期間設定を±1調整することで再計算が強制され、インジケーターが再表示されます。
--------------------------
他のインジケーターもぜひご覧ください!
https://ctrader.com/products/1181
https://ctrader.com/products/1182
https://ctrader.com/products/1180
https://ctrader.com/products/1015
https://ctrader.com/products/555
https://ctrader.com/products/553
https://ctrader.com/products/554
https://ctrader.com/products/552
https://ctrader.com/products/557
https://ctrader.com/products/845
https://ctrader.com/products/848
https://ctrader.com/products/847
https://ctrader.com/products/846
https://ctrader.com/products/551
https://ctrader.com/products/574
https://ctrader.com/products/573
https://ctrader.com/products/556
https://ctrader.com/products/558
5 | 67 % | |
4 | 33 % | |
3 | 0 % | |
2 | 0 % | |
1 | 0 % |


