
説明
✔ データを入力するウェブサイト、指標タブに入力してください: https://tradingeconomics.com/
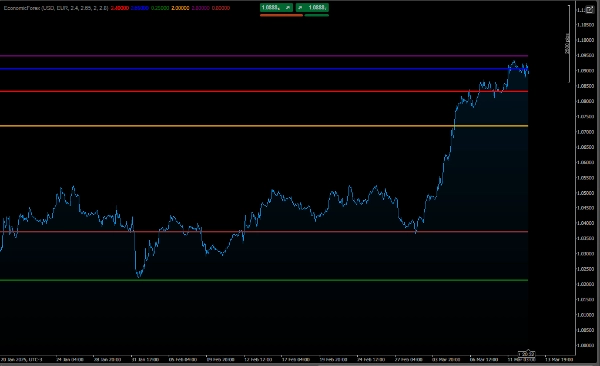
グラフの解釈方法
名目金利と実質金利の違い:
名目金利は金利の総額です。
実質金利はインフレを考慮し、お金の実際の購買力を示します。
インフレ率が名目金利より高い場合、実質金利はマイナスとなり、購買力の損失を示します。
通貨の比較:
グラフは2つの通貨の経済状況を比較することができます。
例えば、主要通貨の実質金利が相手通貨より高い場合、主要通貨の方が投資に魅力的であることを示すかもしれません。
時間の経過による変化:
線はインフレ率、名目金利、実質金利が時間とともにどのように変化するかを示し、トレンドを特定することができます。
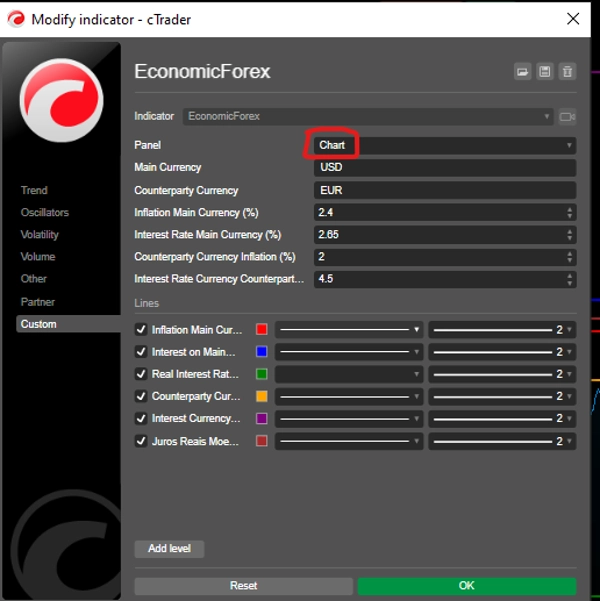
使用例
パラメータを以下のように設定したとします:
主要通貨:USD(米ドル)
インフレ率:5%
名目金利:6.5%
相手通貨:EUR(ユーロ)
インフレ率:2%
名目金利:4%
チャートは以下を示します:
USD:
実質金利:1.5%(6.5% - 5%)
EUR:
実質金利:2%(4% - 2%)
これにより、USDとEURの経済状況を比較し、為替市場で情報に基づいた意思決定ができます。
結論
このコードは、為替ペアの2つの通貨の経済指標を監視および比較したいトレーダーやアナリストにとって有用なツールです。インフレ率、名目金利、実質金利に関する洞察を提供し、マクロ経済の状況と為替市場への影響を理解するのに役立ちます。
この低リスクアルゴリズムをご覧ください:👇🏻
https://ctrader.com/pt/products/601?u=carneiroads
https://ctrader.com/pt/products/623?u=carneiroads
概要
AIによる概要
EconomicForex is an indicator designed for forex traders and analysts to monitor and compare key economic indicators of two currencies within a forex pair. It visualizes inflation rates, nominal interest rates, and real interest rates on a line chart, enabling users to assess the macroeconomic environment and its impact on currency valuation.
The indicator distinguishes between nominal interest rates (the gross interest rate) and real interest rates (adjusted for inflation), highlighting the purchasing power of money. It allows comparison of economic conditions between a main currency and a counterparty currency by plotting their respective inflation, nominal, and real interest rates over time. This helps identify trends and relative investment attractiveness; for example, a higher real interest rate in the main currency compared to the counterpart may indicate greater investment appeal.
Users input data such as inflation and nominal interest rates for each currency, which can be sourced from economic data websites like TradingEconomics.com. The tool supports informed decision-making in the forex market by providing a clear view of evolving economic factors affecting currency pairs.
インジケーターのプロフィール
カスタマーレビュー
0.0
レビュー: 0
カスタマーレビュー
この商品にはまだレビューがありません。お使いになったことがある方は、ぜひレビューをお願いします。
ディスカッション
よくあるご質問
Forex
EURUSD
cTrader Storeで入手可能な取引ボット、インジケーター、プラグインなどの商品は、第三者の開発者が提供するものであり、情報と技術の取得のみを目的としてご利用いただけます。cTrader Storeはブローカーではなく、投資助言や個人的な推奨を行うことも、将来のパフォーマンスを保証することもありません。


価格
117
販売
9.86K
無料インストール