
설명
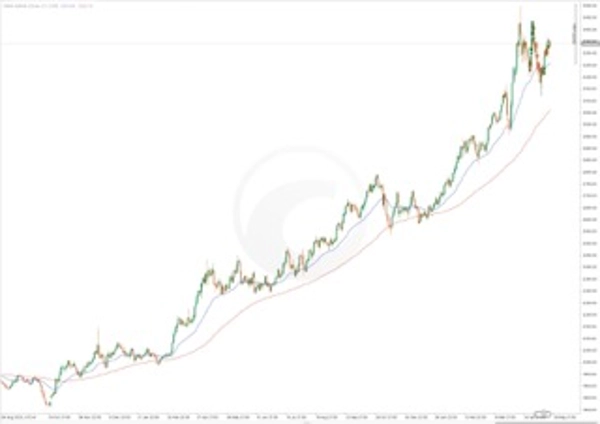
The FAMA-MAMA Indicator는 시장 방향에 대한 더 명확한 통찰이 필요한 트레이더를 위해 만들어진 동적이고 적응적인 추세 도구입니다. MESA 적응 이동 평균(MAMA)과 그 동반선(FAMA)을 기반으로 하며, 이 지표는 변화하는 시장 상황에 맞춰 조정되어 추세 변화를 강조하고 차트 노이즈를 줄입니다.
하이라이트:
- 적응형 추세선: MAMA는 시장 주기에 맞춰 조정되어 추세가 형성되는 조건에서는 더 민감하게 반응하고 횡보 구간에서는 더 부드럽게 작동합니다.
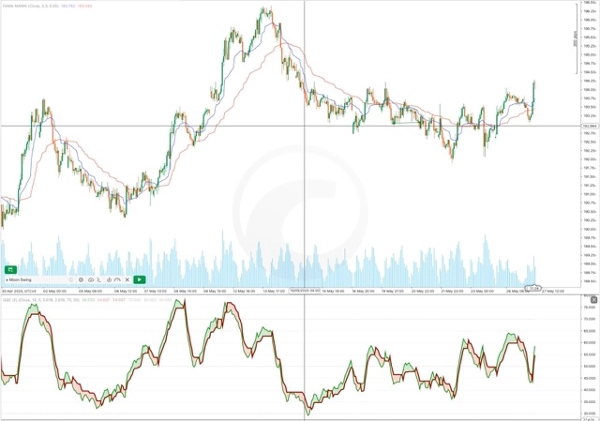
- 명확한 교차 신호: MAMA가 FAMA를 교차할 때 매수 및 매도 신호가 생성됩니다.
- 사용자 설정 가능: 색상, 선 스타일, 민감도를 변경하여 전략과 시각적 선호도에 맞출 수 있습니다.
- 시각적 통합: 차트에 직접 표시되어 신호 인식이 용이합니다.
신호 논리:
- MAMA가 위로 FAMA를 교차할 때 → 상승 모멘텀
- MAMA가 아래로 FAMA를 교차할 때 → 하락 모멘텀
이 지표는 당일 거래 및 스윙 트레이딩을 포함한 다양한 거래 스타일에 적합하며, 트레이더가 시장 추세를 명확하고 자신 있게 추적할 수 있도록 도와줍니다.
요약
AI 요약
The FAMA-MAMA Indicator is an adaptive trend-following tool designed to provide clearer insight into market direction. It is based on the MESA Adaptive Moving Average (MAMA) and its companion line, FAMA. This indicator dynamically adjusts to changing market conditions, enhancing responsiveness during trending phases and smoothing out noise in ranging markets.
Key features include:
- Adaptive trend lines that respond to market cycles.
- Clear buy and sell signals generated when MAMA crosses above or below FAMA, indicating upward or downward momentum respectively.
- Customizable settings allowing users to modify colors, line styles, and sensitivity to align with their trading strategies and visual preferences.
- Direct chart integration for straightforward signal recognition.
Suitable for various trading styles such as intraday and swing trading, the FAMA-MAMA Indicator assists traders in tracking market trends with improved clarity and confidence.
지표 프로필
고객 리뷰
5.0
리뷰: 1
5 | 100 % | |
4 | 0 % | |
3 | 0 % | |
2 | 0 % | |
1 | 0 % |
상담
자주 묻는 질문(FAQ)
Signal
트레이딩 봇, 지표, 플러그인 등 cTrader Store에서 제공되는 상품은 제3자 개발자에 의해 제공되며, 이는 단순히 정보 및 기술적 접근을 목적으로 제공된 것입니다. cTrader Store는 중개인이 아니며, 투자 조언, 개인별 추천 또는 향후 성과에 대한 어떠한 보장도 제공하지 않습니다.


!["[CB] Pivot Points Pro" 로고](https://cdn.ctrader.com/image/webp/43463c82-67b0-4f10-a4ba-901bba091d81_32594)


가격
12
판매
415
무료 설치