설명
IR Open Connector
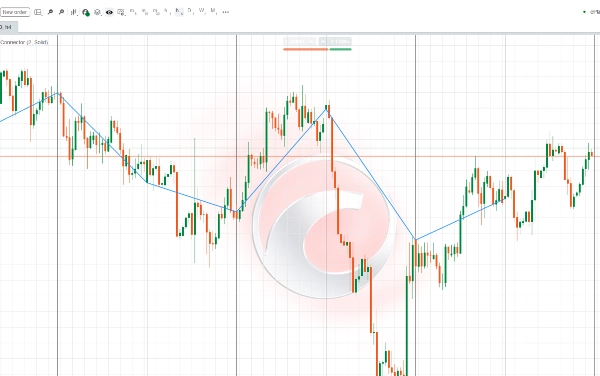
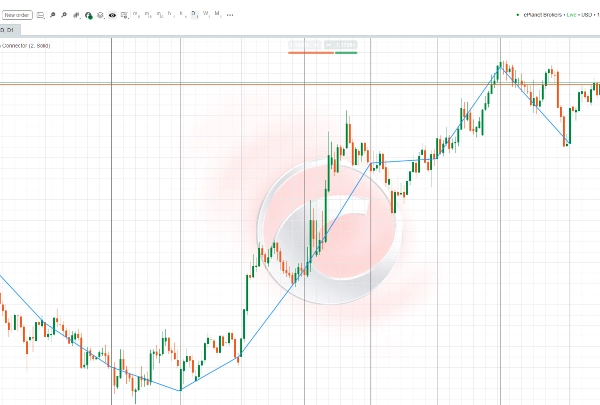
이 지표는 현재 차트 시간 프레임에 따라 상위 시간 프레임 캔들의 시가를 연결하도록 설계되었습니다:
- 시간 프레임이 1시간 미만인 경우 → 일간 캔들의 시가를 연결합니다.
- 시간 프레임이 4시간인 경우 → 주간 캔들의 시가를 연결합니다.
- 시간 프레임이 4시간보다 크고 주간보다 작은 경우 → 월간 캔들의 시가를 연결합니다.
이 기능은 트레이더가 차트에서 상위 기간(일간, 주간, 월간)의 주요 시가 수준을 명확하게 시각화할 수 있게 해줍니다. 이 수준들은 종종 중요한 지지 및 저항 영역, 잠재적 추세 시작 구역, 그리고 시장 분석에서 중요한 기준점으로 작용합니다.
선의 색상, 두께 및 스타일은 완전히 사용자 정의할 수 있어 개인 거래 스타일에 맞게 표시를 조정할 수 있습니다.
این اندیکاتور طراحی شده تا نقاط باز شدن کندلهای تایمفریمهای بالاتر را بسته به تایمفریم فعلی شما به هم متصل کند:
- اگر تایمفریم کمتر از یک ساعت باشد → باز شدن کندلهای روزانه را به هم وصل میکند.
- اگر تایمفریم چهارساعته باشد → باز شدن کندلهای هفتگی را به هم وصل میکند.
- اگر تایمفریم بزرگتر از چهارساعته و کوچکتر از هفتگی باشد → باز شدن کندلهای ماهانه را به هم وصل میکند.
این ویژگی به معاملهگر کمک میکند تا به سادگی سطوح مهم شروع دورههای بزرگتر (روزانه، هفتگی، ماهانه) را روی نمودار مشاهده کند. این سطوح اغلب بهعنوان نقاط کلیدی حمایت و مقاومت، شروع روندهای جدید یا محدودههای معاملاتی مهم در نظر گرفته میشوند.
با تنظیم رنگ، ضخامت و نوع خط، میتوانید نمایش این خطوط را مطابق با سبک معاملاتی خود شخصیسازی کنید.