Trend Strength Signals St3llars33r
Wskaźnik
Wersja 1.0, Aug 2025
Windows, Mac
Od 26/05/2025
451.48M
Wolumen transakcji
61.16K
Zysk w pipsach
15
Sprzedaż
1.43K
Bezpłatne instalacje
Opis
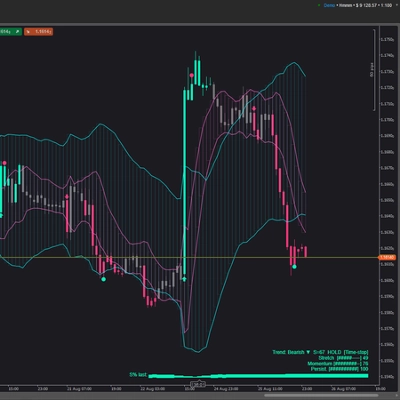
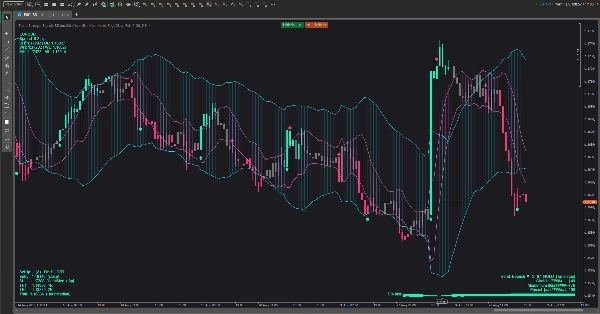
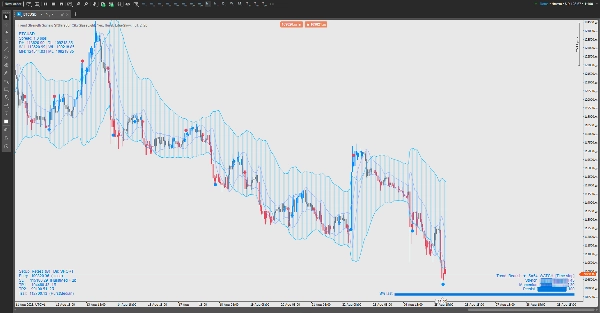
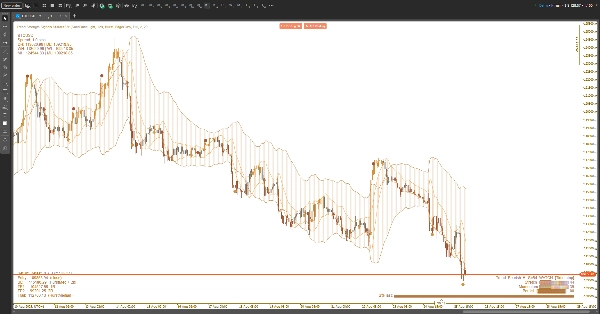
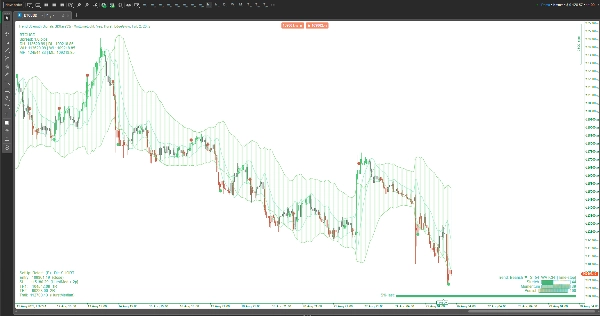
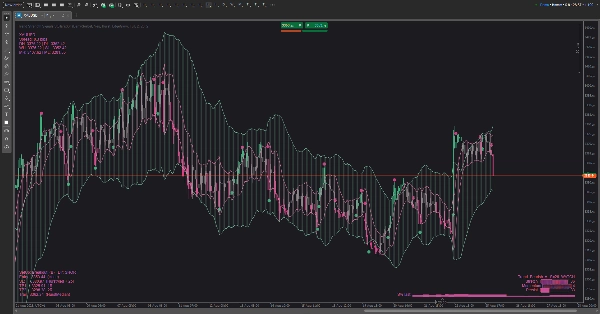
Wizualny zestaw narzędzi do handlu trendami, który łączy obwiednię zmienności z kanałem uwzględniającym cykle, aby na pierwszy rzut oka pokazać reżim, timing i ryzyko. Został zaprojektowany tak, aby był czytelny na każdym tle (jasnym/ciemnym) i utrzymywał ekran w czystości, jednocześnie dając wskazówki „co robić dalej”.
Co widzisz na wykresie
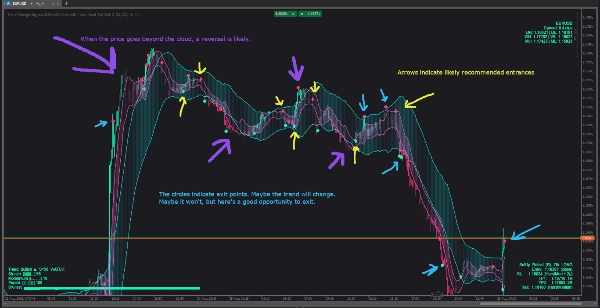
- Chmury (można przełączać):
-
- Chmura zmienności, która rozszerza się/kurczy wraz z aktywnością rynku.
- Chmura cyklu, która śledzi rytm cenowy w ruchu.
- Możesz pokazać jedną, obie lub żadną.
- Sygnały: dyskretne strzałki w górę/w dół wskazujące potencjalne zmiany trendu; małe kropki sugerujące realizację zysków.
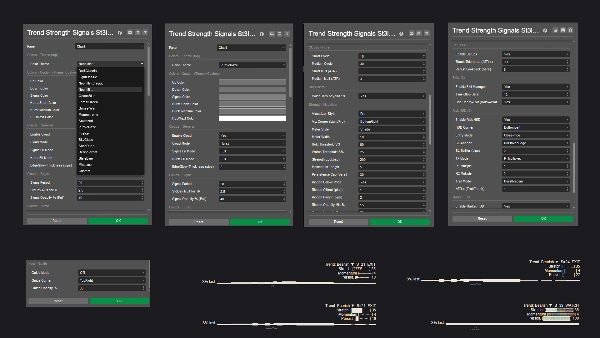
- Wskaźnik siły trendu (HUD) (trzy style):
-
- Lekki — kompaktowa etykieta statusu.
- Pro — mały panel z trzema wskaźnikami (rozciągnięcie, momentum, wytrwałość) oraz mini wykresem historii.
- Wstążka — miękki pasek blisko ceny, którego intensywność odzwierciedla siłę trendu.
- Wskaźnik ryzyka (HUD): proponuje kierunek, obszar ochronnego stopu, dwa warstwowe cele zysku oraz opcjonalny pomysł trailingu. Może być umieszczony w dowolnym rogu i aktualizuje się wraz z rozwojem świecy.
- Wskaźnik rynku (HUD): symbol i spread, plus odniesienia do maksimum-minimum dnia/tygodnia/miesiąca, dzięki czemu zawsze wiesz, gdzie jesteś na większej mapie.
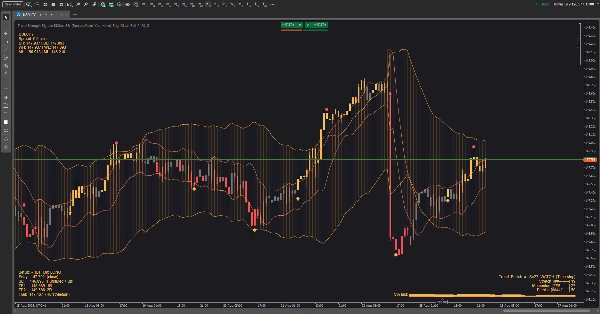
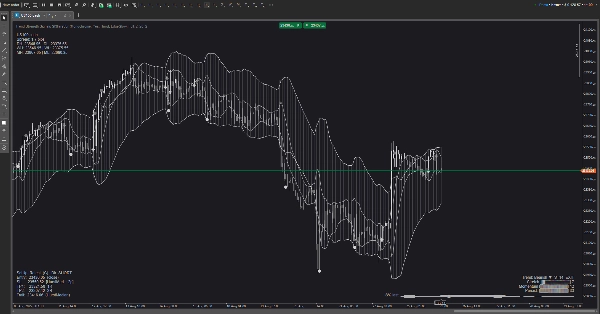
- Motywy: wyselekcjonowane zestawy kolorów dla jasnych i ciemnych wykresów (oraz tryb niestandardowy). Wszystkie elementy graficzne — w tym HUD-y i sygnały — dostosowują się do aktywnego motywu.
Jak z tego korzystać (praktycznie, nie technicznie)
- Wybierz widok chmury:
-
- Użyj chmury zmienności, aby zobaczyć ściskania i rozszerzenia.
- Użyj chmury cyklu, aby ocenić rotacje „na krawędzi” vs „w środku”.
- Użyj obu, jeśli chcesz kontekst + timing.
- Odczytaj siłę trendu:
-
- Gdy status wzrasta do HOLD, preferuj transakcje zgodne z aktualnym kierunkiem; gdy spada do WATCH, zmniejsz agresję; jeśli pokazuje EXIT, unikaj nowych transakcji lub zaostrz ryzyko.
- W trybie Pro, rosnące wskaźniki + rosnący wykres iskierkowy = poprawa jakości; zanikające wskaźniki = zarządzaj ryzykiem w dół.
- Dopasuj wejścia czasowo względem ceny i chmury:
-
- Przełamania po kompresji, ponowne wejścia po uprzejmym cofnięciu do chmury lub odbicia od zewnętrznej krawędzi to podstawowe wzorce.
- Jeśli wczesna strzałka pojawi się w środku świecy, a potem zniknie, poczekaj na potwierdzenie zamknięcia świecy, jeśli wolisz mniej fałszywych sygnałów.
- Zarządzaj transakcją za pomocą wskaźnika ryzyka (HUD):
-
- Umieść ochronny stop mniej więcej poza najbliższą granicą strukturalną wskazaną przez HUD.
- Skaluj wyjścia na TP1, resztę pozostaw na TP2 lub podążaj za sugerowaną linią trailingu.
- Jeśli siła trendu słabnie z mocnej do słabej, rozważ wcześniejsze wyjście.
- Filtry sytuacyjne:
-
- Unikaj wejść, gdy chmury są cienkie i niestabilne, lub gdy status siły jest w EXIT.
- Preferuj transakcje, gdy siła rośnie, chmura jest nachylona, a cena czysto współdziała z krawędziami.
Personalizacja
- Zmieniać rogi HUD, styl wizualizacji i motyw kolorystyczny, aby dopasować do swojego miejsca pracy.
- Motywy przyjazne dla jasnych wykresów utrzymują tekst widoczny na białym tle; palety ocean/las/zachód słońca dodają subtelny kontrast bez olśnienia.
Czym nie
To nie jest czarna skrzynka do automatycznego handlu. To pomoc decyzyjna: ramuje jakość trendu, proponuje rozsądne lokalizacje ryzyka i podkreśla momenty o wysokim prawdopodobieństwie — ale to Ty masz kontrolę.
Podsumowanie
Profil wskaźnika
Opinie klientów
0.0
Opinie: 0
Opinie klientów
Ten produkt nie ma jeszcze opinii. Wypróbowałeś(-aś) go już? Bądź pierwszy(-a) i powiedz o tym innym!
Dyskusja
Częste pytania
Produkty dostępne za pośrednictwem cTrader Store, w tym boty handlowe, wskaźniki i wtyczki, dostarczane są przez deweloperów zewnętrznych i udostępniane wyłącznie w celach informacyjnych oraz w celu zapewnienia dostępu technicznego. cTrader Store nie jest brokerem i nie zapewnia doradztwa inwestycyjnego, nie udziela spersonalizowanych rekomendacji ani nie gwarantuje przyszłych wyników.


Cena
Od 26/05/2025
451.48M
Wolumen transakcji
61.16K
Zysk w pipsach
15
Sprzedaż
1.43K
Bezpłatne instalacje