present
가입하고 첫 구매 시 $50 할인을 받으세요
Trading product for Heikin Ashi Candlestick 지표 Forex Crypto, image 1
Heikin Ashi Candlestick
지표
2 다운로드
버전 1.0, Sep 2025
Windows, Mac
Trading product for Heikin Ashi Candlestick 지표 Forex Crypto, image 2
Trading product for Heikin Ashi Candlestick 지표 Forex Crypto, image 3
가입일 15/06/2025
780
무료 설치

설명

헤이킨 아시 캔들스틱 지표

이 지표는 헤이킨 아시 캔들을 차트에 직접 표시합니다.

설치 방법:

  • 원하는 차트에 지표를 드래그하세요.
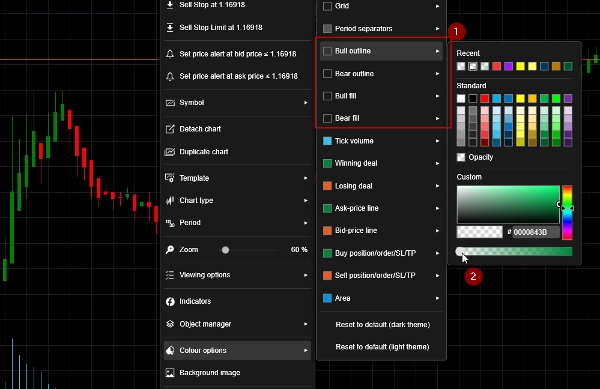
  • 차트에서 오른쪽 클릭 후 "Colour options"를 선택하세요.
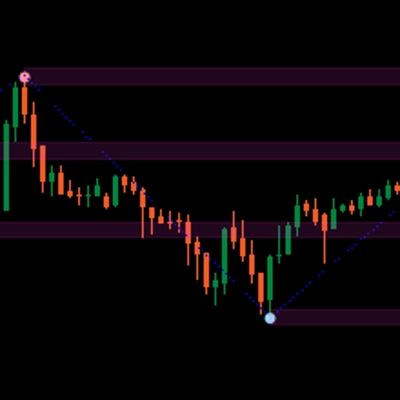
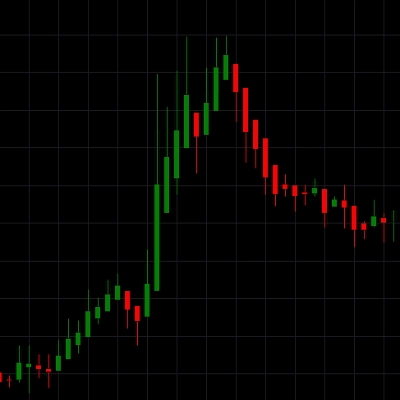
  • Bull Outline, Bull Fill, Bear Outline 및 Bear Fill을 "Transparent"로 설정하세요. 스크린샷 1을 참조하세요.

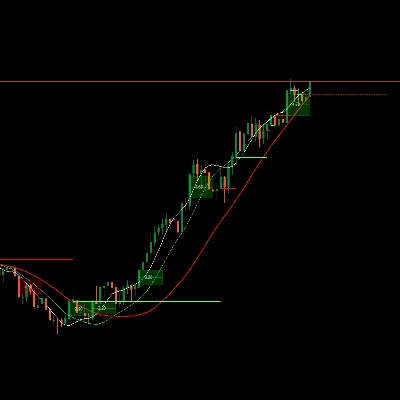
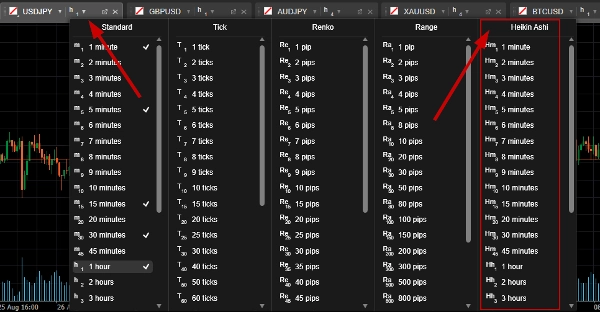
지표 없이 헤이킨 아시 캔들을 표시하려면 스크린샷 2를 참조하세요.

요약

AI summary
The Heikin Ashi Candlestick indicator displays Heikin Ashi candles directly on trading charts. It modifies traditional candlestick visuals to provide a smoothed representation of price action, which can help in identifying trends more clearly. Installation involves dragging the indicator onto the desired chart and adjusting color settings to make the standard candle outlines and fills transparent, allowing the Heikin Ashi candles to be prominently displayed. This indicator is applicable across multiple markets including Forex, cryptocurrencies, and stocks. It integrates seamlessly with existing chart setups to enhance visual analysis without altering underlying price data.
지표 프로필

고객 리뷰

0.0
리뷰: 0
고객 리뷰
이 상품에 대한 리뷰가 아직 없습니다. 이미 사용해 보셨나요? 다른 사람들에게 가장 먼저 소개해 주세요!

상담

자주 묻는 질문(FAQ)

Forex
Crypto
Stocks
트레이딩 봇, 지표, 플러그인 등 cTrader Store에서 제공되는 상품은 제3자 개발자에 의해 제공되며, 이는 단순히 정보 및 기술적 접근을 목적으로 제공된 것입니다. cTrader Store는 중개인이 아니며, 투자 조언, 개인별 추천 또는 향후 성과에 대한 어떠한 보장도 제공하지 않습니다.
이 작성자의 상품 더 보기

지표
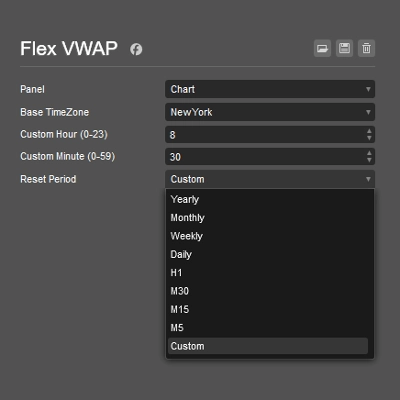
Flexible VWAP indicator with timezone-aware, custom time periods and automatic DST handling.
지표
Simple MACD Histogram with color-coded rising (green) and falling (red) momentum bars.

좋아하실 만한 다른 항목

지표
ATR
RSI
+5
Multi-factor VWAP mean-reversion signals with ATR bands, volume exhaustion, and RSI gate on cTrader.
지표
Doji
Transform Your Charts Instantly with 20+ Professionally Designed Themes
지표
Forex
BTCUSD
+12
🎯Automatically identifies the market's significant turning points (key H & L) and draws dynamic support and.....✍️
지표
ATR
RSI
+1
Super Trend Rsi ,ATR + trend change distance + dynamic Alpha, divergence/convergence
지표
EMA
MACD
+5
Multi-timeframe MACD with color-changing line, 4-color histogram & triangle signals.
지표
ATR
Wedge
+2
Strong Supertrend Turn Market Movement into a Clear Map Market analysis
지표
Forex
EURUSD
+5
Fimathe Indicator - Fimathe PCM - Automated Trend Channels & Levels — Ideal for live trading and backteting
지표
RSI
BTCUSD
+5
Z-Score: Measures price deviations from its mean. Spots overbought/sold (±2-3 SD) & reversals. Key for stats trading
지표
Prop
Forex
+4
Automatic Support/Resistance zones from swing points.
지표
RSI
MACD
+2
A straightforward yet effective tool signals entry points for both buying and selling. Include 3 Moving Average
지표
Displays the previous day's, last week's, and last month's highest and lowest price levels on your chart.
지표
This indicator is a valuable tool for traders looking to identify significant opening price level of any asset.
지표
BOS
Fibonacci
+4
Automatically draws major trading sessions, killzones, and SMC daily liquidity targets directly on your cTrader charts.
지표
Grid
Prop
+5
Logarithmic Framework by LudwigICT
지표
MACD
Forex
+2
a revolutionary indicator that integrates volume into MACD.
지표
Prop
Forex
+11
🧭 See when your market tends to move—by Month, Day-of-Week, or Hour-of-Day🧭
지표
Risk Dashboard
AI-powered daily range forecasts help traders spot volatility opportunities and plan stops and targets.
지표
Shows daily and sessions highs / lows and session boxes, everything configurable

가격

가입일 15/06/2025
780
무료 설치