Açıklama
Fiyat kaosunu hassas regresyon matematiği ile net trend kanallarına dönüştürün.
Regresyon Kanalı, seçtiğiniz fiyat verileri üzerinden doğrusal bir regresyon çizgisi hesaplar ve fiyat sapmalarına dayalı üst/alt sınırlar çizer - size trend yönü ve potansiyel dönüş bölgeleri hakkında istatistiksel temelli bir görüş sunar.
Mükemmel İçin
- Nesnel trend tanımı arayan yapı tüccarları
- Aşırı alım/aşırı satım uçlarını belirleyen ortalama dönüş tüccarları
- Kanal ihlallerini ve momentum değişimlerini tespit eden kırılma tüccarları
- Çoklu zaman dilimi analizi - bağlam için günlük grafiklerde aylık regresyonu çizin
Ana Özellikler
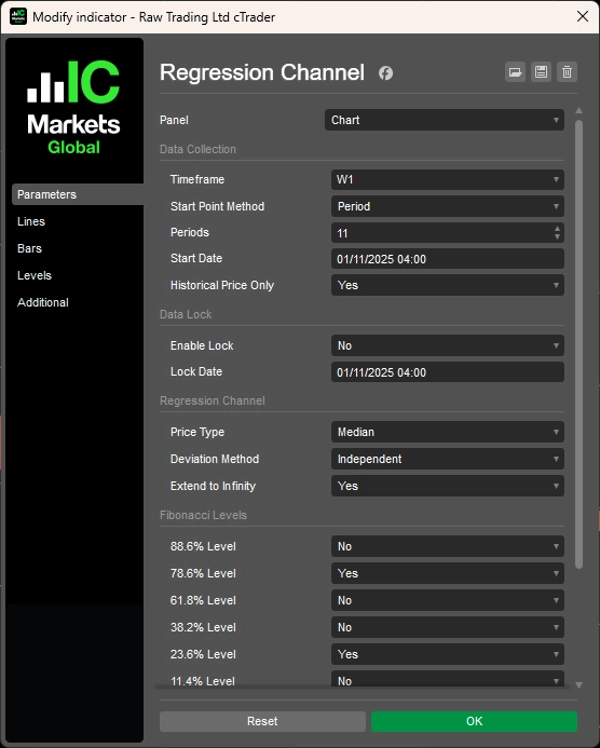
- Esnek Veri Seçimi
-
- Dönem Modu: Son N barı analiz edin (örneğin, son 12 aylık mum)
- TarihSaat Modu: Belirli piyasa olayları veya tarihlerden başlayın
- Kilitleme Mekanizması: Fiyat devam ederken analizleri tarihsel bir noktada dondurun
- Çoklu Zaman Dilimi: Mevcut grafiğinizde herhangi bir zaman diliminden regresyon çizin
- Akıllı Sapma Yöntemleri
-
- Ortalama: Ortalama sapmalar kullanılarak dengeli seviyeler (ticaret bölgeleri için ideal)
- Bağımsız: Yönlü volatiliteye uyum sağlayan asimetrik kanallar
- Maksimum: Tam kapsam analizi için aşırı fiyat sınırlarını gösterir
- Profesyonel Araçlar
-
- 6 Fibonacci düzeltme seviyesi (11.4%, 23.6%, 38.2%, 61.8%, 78.6%, 88.6%)
- 6 fiyat türü: Açılış, Yüksek, Düşük, Kapanış, Medyan, Tipik
- Sadece tarihsel mod: Kararlı geriye test için oluşan barları hariç tutar
- Uzun vadeli projeksiyonlar için sonsuzluğa uzatma seçeneği
- Tam renk özelleştirmesi
Neden Öne Çıkıyor
Temel regresyon araçlarının aksine, bu gösterge size kontrol sağlar. Analizinizi belirli bir olaydan sonra fiyatın nasıl davrandığını incelemek için kilitleyin. Simetrik ve asimetrik kanallar arasında geçiş yapın. Daha yüksek zaman dilimi yapısını daha düşük zaman dilimi uygulamasıyla birleştirin - hepsi güvenilirlik için temiz, verimli kodla oluşturulmuştur.
Temiz grafikler. Net yapı. Kendinden emin kararlar.