present
Registrati e ricevi uno sconto da $50 sul tuo primo acquisto
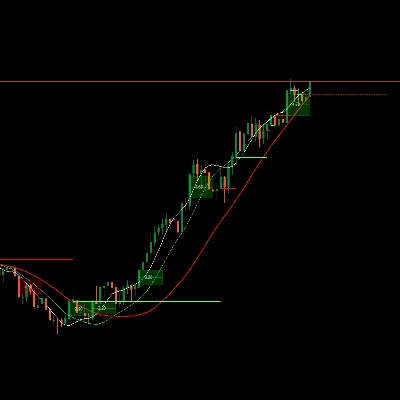
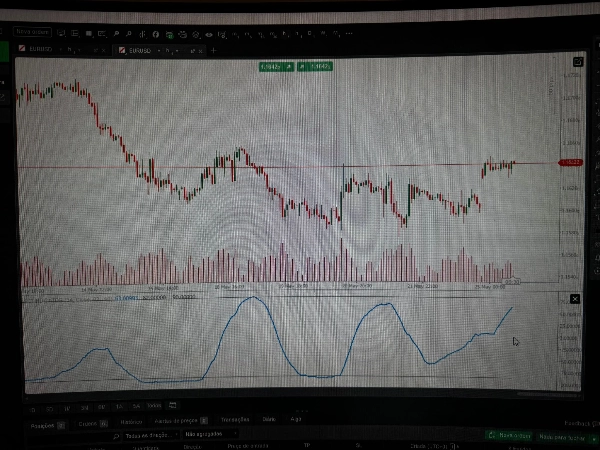
Trading product for RCI INDICATOR Indicatore Fibonacci Bollinger Bands, image 1
RCI INDICATOR
Indicatore
Versione 1.0, May 2026
Windows, Mac
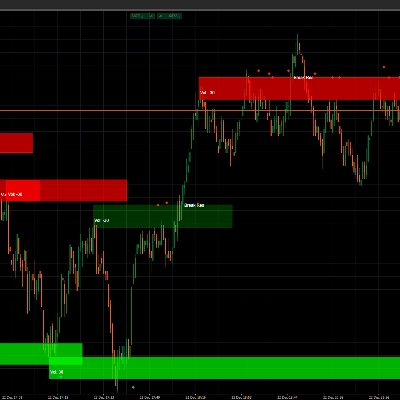
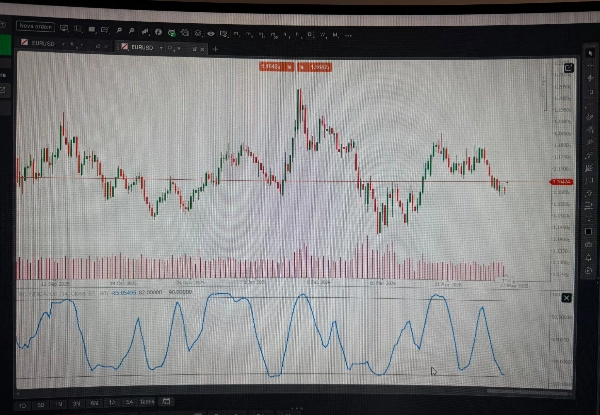
Trading product for RCI INDICATOR Indicatore Fibonacci Bollinger Bands, image 2
Trading product for RCI INDICATOR Indicatore Fibonacci Bollinger Bands, image 3
Da 28/11/2025

Descrizione

Rank Correlation Index (RCI) – Identify Trend Strength & Potential Reversals

The Rank Correlation Index (RCI) is a momentum oscillator that analyzes the correlation between price ranking and chronological ordering. The more consistently prices rise, the closer the RCI moves to +100; the more consistently they fall, the closer it moves to -100. Values near zero indicate a lack of trend or a sideways market.


The indicator analyzes:

  • RCI evaluates the consistency of price direction over a given period.
  • Unlike traditional oscillators (e.g., RSI), RCI is less sensitive to noise and better highlights trend strength.

Key parameters:

  • Period – number of bars used (default: 14 or 27).
  • Source Type – Close, Typical, Median, or Weighted price.
  • Upper/Lower levels – adjustable overbought/oversold thresholds.
  • Signal line (optional) – moving average of RCI for crossovers.

Typical use cases:

  • Trend confirmation – consistently positive/negative RCI reinforces direction.
  • Pullback entries – wait for RCI to exit extreme zones and re-enter with the main trend.
  • Exhaustion detection – extreme values + divergences hint at possible reversals.

Trader profile:

  • Suitable for day traders, swing traders, and position traders using technical analysis.
  • Appropriate for intermediate and advanced traders, but beginners can use it after studying the concept.

Notes:

  • In sideways markets, RCI may produce false crossovers – use in conjunction with trend analysis.
  • Do not use RCI alone; combine with support/resistance or other indicators.

Riepilogo

Profilo indicatore
Categoria indicatore
Momentum
Tipo di output
Visualizzazione
Segnali
Requisiti per i dati
Solo barre
Segnali supportati
Superamento
Divergenza
Forza del trend
Livello raggiunto
Livello rotto

Discussioni

Recensioni dei clienti

0.0
Recensioni: 0
Recensioni dei clienti
Questo prodotto non ha ancora ricevuto recensioni. L'hai già provato? Fallo sapere agli altri per primo!

Domande frequenti

Fibonacci
Bollinger Bands
Supertrend
Key Levels
RSI
ATR
MACD
I prodotti disponibili tramite cTrader Store, inclusi bot di trading, indicatori e plugin, sono forniti da sviluppatori terzi e resi disponibili esclusivamente a scopo informativo e di accesso tecnico. cTrader Store non è un broker e non fornisce consulenze in materia di investimento, raccomandazioni individualizzate o garanzie di risultati futuri.

Potrebbe interessarti anche

Indicatore
Forex
BTCUSD
+8
The traditional Hull Moving Average with different colours based on the slope (direction) of the trend.
Indicatore
Drawdown Monitor
Protect your funded account. Real-time Daily Equity Drawdown monitor with Green / Orange / Red flashing alerts.
Indicatore
Forex
EURUSD
+7
Institutional Session Levels Pro OHLC,Prev(D,W,M OHLC)
Indicatore
EMA
RSI
+5
MACD Colour Histogram with 11 Moving Average Types, Multi-timeframe confirmation and Sound Signal Alert.
Indicatore
Prop
Forex
+4
Draws pivots (P, S/R, CPR) from selected anchors like H1–Month1, with optional mid-levels (PS1, S1S2, etc.)
Indicatore
CandleCounterAlex – Candle Cycle Counter with Colors and Adjustable Position.
Indicatore
The Break of Structure (BoSCHoCh) Indicator is a smart market structure tool designed to help traders easily spot trend.
Indicatore
Prop
Forex
+5
Traders Panel: Scan 15 pairs across 5 timeframes. Live heatmap, strength rankings and best setups in one panel.
Indicatore
ATR
BOS
+5
Opening ranges, dynamic trend channels, and multi-scale breakout/retest analysis for clear intraday chart decisions.
Indicatore
RSI
MACD
+2
A straightforward yet effective tool signals entry points for both buying and selling. Include 3 Moving Average
Indicatore
ADX
ATR
+5
Configure, simulate, and analyze trading strategies with custom filters, multi-target exits, and detailed performance me
Indicatore
EMA
RSI
+4
🚀📈 Plot buy/sell signals on Range Bars using Moving Averages and RSI. Clear, actionable trading insights.🚀📈
Indicatore
BOS
EMA
+5
VWAP Bands indicator with 3 standard deviation levels, buy/sell zones, and a draggable ON/OFF button to toggle the entir
Indicatore
AI
ATR
+27
Support and Resistance with signals
Indicatore
ATR
MSS
+5
Advanced market structure and institutional cycle mapper with visual reference cards and entry alerts
Indicatore
SMC
NAS100
+5
Rolling Volume Profile MTF with 24H, 7D, 30D profiles and a precise NY Open marker.
Logo di "UT Bot"
Popolare
4.4
(5)
$19
/
$20
Indicatore
ATR
Forex
+11
Trend-following indicator with dynamic ATR-based trailing stop for precise entry/exit signals
Indicatore
Imbalance
Fair Value Gap
+1
Multi-symbol, multi-timeframe Fair Value Gaps in one panel.

Prezzo

Da 28/11/2025