MARCs_MARKET_OVERVIEW_LITE_XAUUSD
지표
1 다운로드
버전 1.0, Aug 2026
Windows, Mac
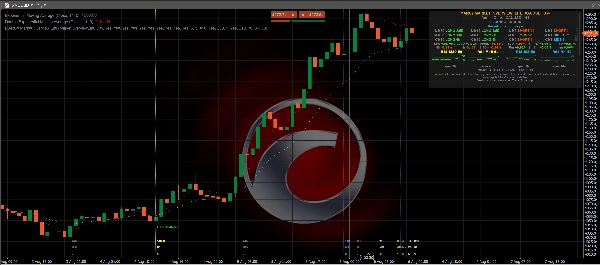
Trading product for MARCs_MARKET_OVERVIEW_LITE_XAUUSD 지표 Key Levels RSI, image 2
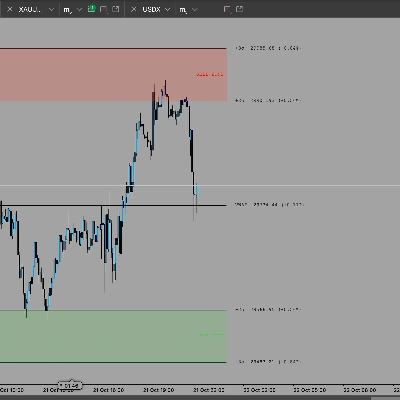
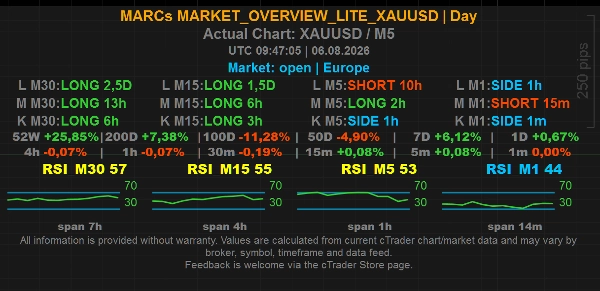
Trading product for MARCs_MARKET_OVERVIEW_LITE_XAUUSD 지표 Key Levels RSI, image 3
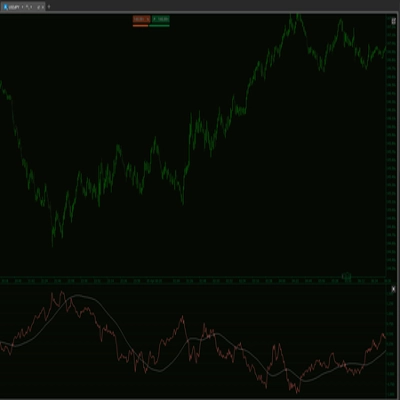
Trading product for MARCs_MARKET_OVERVIEW_LITE_XAUUSD 지표 Key Levels RSI, image 4
Trading product for MARCs_MARKET_OVERVIEW_LITE_XAUUSD 지표 Key Levels RSI, image 5
가입일 24/06/2026
1
무료 설치

설명

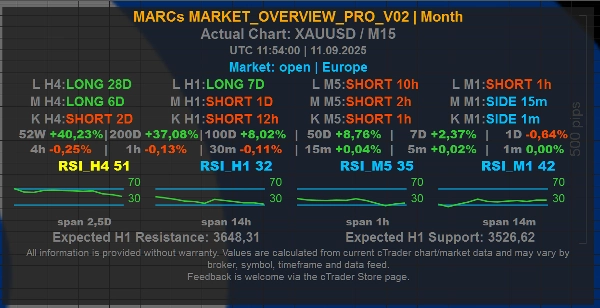
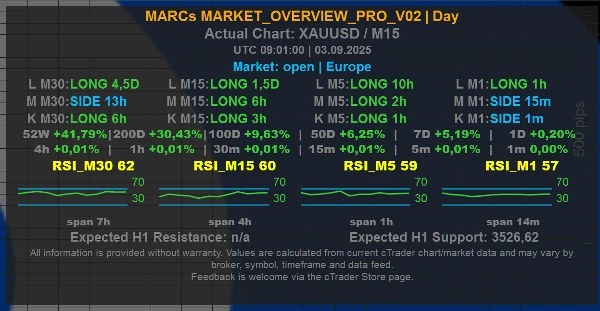
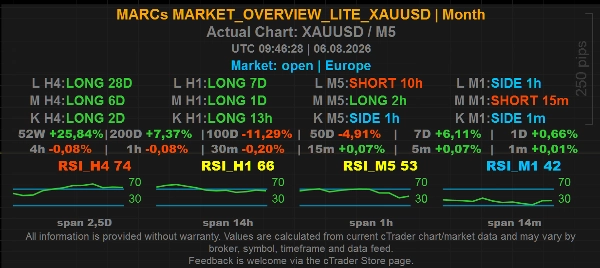
MARCs Market Overview Lite XAUUSD is a free, reduced-scope market overview indicator for cTrader.


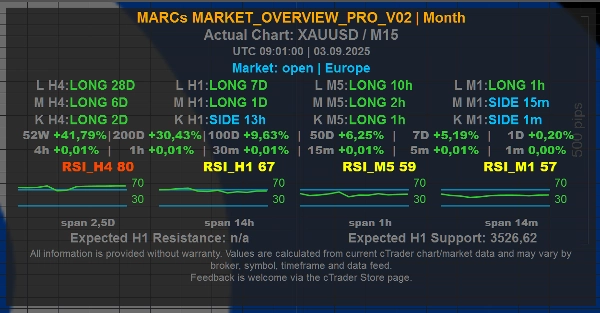
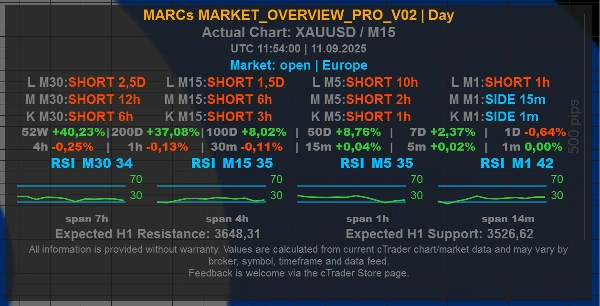
It displays a compact on-chart dashboard for XAUUSD / Gold charts with multi-timeframe trend context, RSI readings, market/session information, optional chart-level values and a simplified set of display controls.


This Lite edition is designed as a focused XAUUSD overview tool. It keeps the core panel workflow of MARCs Market Overview while using fixed internal settings and a limited preset selection.


Main features:

- Free Lite edition for XAUUSD charts

- Compact on-chart market overview panel

- Multi-timeframe trend rows for short, medium and long market context

- RSI values and mini RSI history across fixed internal timeframes

- Market/session line with UTC time

- Day and Month time-horizon presets

- Optional market line

- Optional H1 chart-level values shown directly in the panel

- Optional simplified H1 level lines on the chart

- Optional line labels, level origin markers and lookback markers

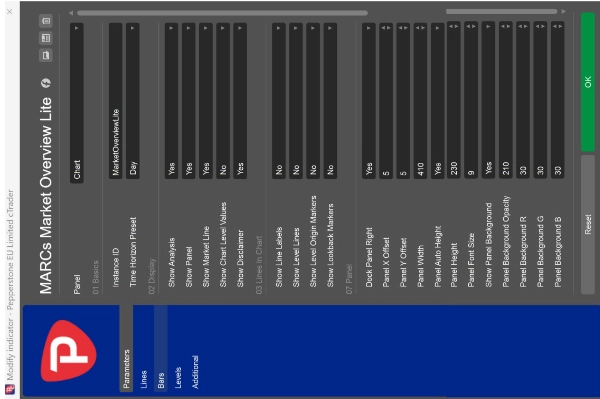
- Fully adjustable panel position, width, height, font size and background appearance


Lite edition limitations:

- Works on XAUUSD charts only

- Time Horizon Preset is limited to Day and Month

- Trend rows use fixed internal timeframe and candle settings

- RSI display uses fixed internal settings

- Time display uses fixed internal settings

- Chart level values are limited to H1

- Chart level lines are available as a simplified on/off option and use fixed H1 levels

- Some advanced customisation options from the Pro version are not included


If the indicator is attached to another symbol, the panel shows a clear XAUUSD-only notice instead of displaying overview values.


Level Lines and Chart Level Values:

The optional Show Level Lines setting can display calculated H1 chart reference levels. In the Lite edition, this is simplified to an on/off option. When enabled, the indicator shows the nearest calculated resistance above the current price and the nearest calculated support below the current price.


The optional Show Chart Level Values setting can show the same nearest H1 resistance/support reference values directly in the panel without drawing lines on the chart. The panel line is labelled, for example, "Chart Levels H1 | R ... | S ..." to make clear that the values refer to chart-level references.


How Level Lines are calculated:

The levels are derived from past swing highs and swing lows in the selected internal timeframe. Nearby swing points are grouped into level clusters, and only areas with enough repeated touches are shown. This makes the lines visual market-context markers based on available chart history.


What Level Lines do not mean:

Level Lines are not buy signals, sell signals, stop-loss recommendations, take-profit recommendations or investment advice. They do not predict that price will reverse, break out or react at a specific level.


About the Pro version:

MARCs Market Overview Pro offers broader symbol use, more time-horizon presets and more detailed customisation options. The Lite XAUUSD edition is a free, focused version for traders who want a simpler Gold/XAUUSD market overview panel.


Important:

MARCs Market Overview Lite XAUUSD is an analysis-only market overview tool. It does not place trades, manage positions, provide investment advice or guarantee trading results.


All readings depend on the available cTrader chart data, broker symbol feed, timeframe and market history. Values may differ between brokers, symbols and data feeds.


Trading involves risk. Past performance does not guarantee future results.


요약

AI 요약
MARCs Market Overview Lite XAUUSD is a market overview indicator designed for cTrader, focused exclusively on XAUUSD (Gold) charts. It provides a compact on-chart dashboard displaying multi-timeframe trend context (short, medium, long), RSI values with mini history, and market/session information with UTC time. The indicator includes fixed Day and Month time-horizon presets and offers optional features such as market lines, H1 chart-level values, simplified H1 level lines, line labels, and level origin markers.
Level lines are calculated from past swing highs and lows on the H1 timeframe, highlighting key resistance and support clusters based on repeated price touches. These lines serve as visual market context markers but do not constitute trading signals or advice.
The panel’s position, size, font, and background appearance are fully adjustable. The Lite edition uses fixed internal settings and limited presets, restricting its use to XAUUSD charts only. It does not place trades or provide investment recommendations. This tool relies on available chart data and broker feeds, which may vary.
This edition offers a streamlined overview for Gold traders, with broader symbol support and customization available in the Pro version.
지표 프로필
지표 카테고리
시장 구조 (SMC)
출력 유형
시각화
필터
데이터 요구 사항
막대만
지원되는 신호
추세 강도
레벨 터치

고객 리뷰

0.0
리뷰: 0
고객 리뷰
이 상품에 대한 리뷰가 아직 없습니다. 이미 사용해 보셨나요? 다른 사람들에게 가장 먼저 소개해 주세요!

상담

자주 묻는 질문(FAQ)

Key Levels
RSI
Market Structure
Risk Dashboard
Support & Resistance
트레이딩 봇, 지표, 플러그인 등 cTrader Store에서 제공되는 상품은 제3자 개발자에 의해 제공되며, 이는 단순히 정보 및 기술적 접근을 목적으로 제공된 것입니다. cTrader Store는 중개인이 아니며, 투자 조언, 개인별 추천 또는 향후 성과에 대한 어떠한 보장도 제공하지 않습니다.

이 작성자의 상품 더 보기

cBot
Conservative
Fixed Risk %
+5
MARCs GOLD H4-Gold-Swing-Bot for XAUUSD with transparent long-term backtests and optional reserve/guard system.
3.01
손익비
지표
RSI
Key Levels
+3
MARCs Multi-timeframe market dashboard with trend rows, RSI context, sessions, presets and optional chart levels.

좋아하실 만한 다른 항목

지표
VWAP
Volume
+2
VWAP Stdev Heatmap: Advanced daily VWAP with 5-tier standard deviation bands and dynamic candlestick coloring.
지표
BOS
EMA
+5
Directional volume heatmap: see if a price zone was built on buying or selling, not just how much.
지표
EMA
VWAP
+2
ORB Range Indicator maps the opening range and gives a practical session-breakout workflow with clear labels.
지표
RSI
Key Levels
+3
MARCs Multi-timeframe market dashboard with trend rows, RSI context, sessions, presets and optional chart levels.
지표
Forex
BTCUSD
+11
📈 Adaptive ALMA-Gaussian hybrid trend filter with precision smoothing and clear buy/sell signals.
지표
ATR
Fibonacci
+4
Emperor Signals Pro is a premium non-repainting indicator for Forex pairs on the 15-minute timeframe
지표
Grid
BTCUSD
+7
A powerful overlay tool designed to automatically plot Fibonacci retracement levels based on a custom window.
지표
Forex
BTCUSD
+10
Automate your price action analysis with stable, time-anchored Support & Resistance zones that adapt to breakouts in rea
지표
Forex
EURUSD
+3
ATR-normalized MA slope in degrees, comparable across all instruments. Color-coded labels flag strong trend moves.
지표
Prop
Forex
+9
Average Cost Price helps you keep track of your open positions on the chart. In doing so, it provides lines and explanat
지표
ADX
EMA
+4
A multi-timeframe dashboard for cTrader that scores trend direction, momentum, and strength across M15, H1, H4, and D1.
지표
Forex
Crypto
+6
The cTrader Chaos Reversals indicator brings high-quality reversal signals to traders.
지표
Bollinger
Jurik Moving Average (Jurik's Moving Average) triple adaptive filter with unique Jurik smoothing and dynamic factor.
지표
Prop
Forex
+4
Pivot Points Standard — All-in-One Multi-Timeframe Pivot Indicator for cTrader
지표
RSI
XAUUSD
+2
Automatic ZigZag swings with dynamic support & resistance levels, labeling highs/lows for clear trend signals.
지표
RSI
Signal
+2
Dynamic circles visualize price's volatility position. Like RSI for market overextension & stretch. Quantify context.
지표
Forex
EURUSD
ECONOMIC FOREX:provides insights into inflation, nominal interest rates and real interest rates, in the line chart
지표
RSI
SMC
+17
Turn WaveTrend Cross into a BTC profit machine precise buy sell signals, smart momentum edge, no lag trading system

가격

가입일 24/06/2026
1
무료 설치