설명
이 지표와 두 개의 다른 지표를 기반으로 설계된 cBot은 다음 링크에서 구매할 수 있습니다: https://ctrader.com/it/products/1056?u=Labot
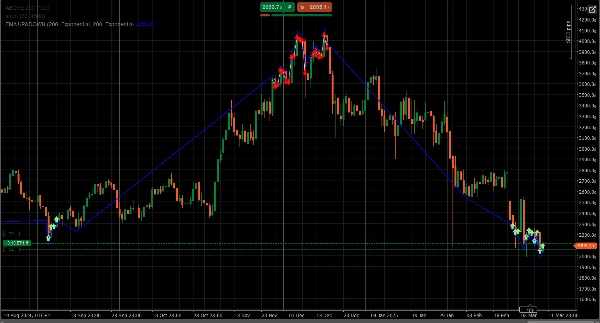
SectorIndex Dual Moving Average Indicator는 정확한 신호 🎯와 시장 변동성 📉📈을 활용할 수 있는 능력을 찾는 이들을 위한 뛰어난 거래 도구입니다. 이 지표는 두 개의 이동평균선—하나는 단기, 다른 하나는 장기—을 활용하여 단순함과 강력함 💪을 결합해 모든 자산과 시간대에 적합합니다.
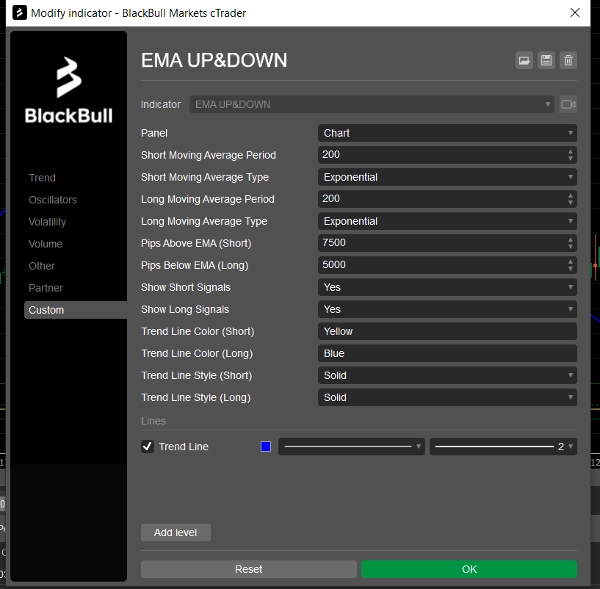
다양한 시장과 자산에 맞게 조정 가능한 매개변수를 통해 이동평균선에 대한 가격 조건에 기반한 정확한 롱 및 숏 신호를 얻을 수 있습니다. 이 지표는 단순히 선을 그리는 것뿐만 아니라 동적 추세선 🔄, 명확한 시각적 신호(숏용 하향 화살표 ⬇️, 롱용 상향 화살표 ⬆️)를 추가하며 선 색상 🎨과 스타일 같은 사용자 정의도 지원합니다.
이 지표는 재량 거래자에게 유용한 도구일 뿐만 아니라, 여러 자동 거래 봇의 기술적 기반으로도 사용되며, 이 상점에서 개발되어 현재 판매 중입니다. SectorIndex Dual MA Indicator의 정확성과 유연성 덕분에, 이를 기반으로 구축된 봇들은 다양한 자산과 전략에 최적화된 알고리즘 거래에 탁월한 통찰력을 제공합니다.
🔥 장점:
- 모든 시간대와 자산에 적응 가능 ⏱️.
- 차트에서 시각적 지원과 함께 정확하고 명확한 신호 👀.
- 완전한 구성 가능성: 평균선 위/아래 핍, 스타일 및 색상 ✨.
- 추세 추종 또는 반대 전략에 탁월한 도구 📊.
- 자동화 봇 개발을 위한 기술적 기반 🤖.
⚠️ 위험: 거래에는 위험이 따르므로 ⚠️, 아무리 강력한 지표라도 수익을 보장할 수 없습니다 💸. 항상 적절한 위험 관리 🛡️를 사용하고 실제 돈을 투입하기 전에 데모 계정에서 지표를 테스트 🧪하세요.
이 지표와 두 개의 다른 지표를 기반으로 설계된 cBot은 다음 링크에서 구매할 수 있습니다: https://ctrader.com/it/products/1056?u=Labot
요약
Designed for adaptability, it supports multiple markets including Forex, cryptocurrencies, commodities, indices, and stocks. It serves both discretionary traders seeking precise entry signals and developers as a technical foundation for automated trading bots. These bots leverage the indicator’s accuracy and flexibility for algorithmic strategies optimized across different assets.
Key features include compatibility with all timeframes and assets, clear visual signals on charts, and extensive customization options. The indicator is suitable for trend-following and contrarian strategies. Users are advised to apply appropriate risk management and test the indicator on demo accounts before live trading. Additional automated bots based on this indicator are available separately.
고객 리뷰
5 | 100 % | |
4 | 0 % | |
3 | 0 % | |
2 | 0 % | |
1 | 0 % |