Opis
🎯 WIELOOKRESOWA INTELIGENCJA ZMIENNOŚCI
Przestań Przegapiać Wybicia Zmienności - Zobacz Wszystkie Okresy Jednocześnie
Większość wskaźników zmienności pokazuje tylko jedną perspektywę. Nasz Wskaźnik Wielookresowej Zmienności Kroczącej daje pełny obraz w krótkim (7), średnim (21) i długim (63) okresie - z wbudowanymi sygnałami handlowymi , które dokładnie mówią, kiedy działać.
⚡ DLACZEGO WIELOOKRESOWA ZMIENNOŚĆ ZMIENIA WSZYSTKO
Pojedynczy Okres vs Nasze Podejście Wielookresowe:
- ❌ Pojedynczy Okres: Widzisz drzewa, ale tracisz las
- ✅ Trzy Okresy: Kompletny krajobraz zmienności z kontekstem
Rzeczywiste Scenariusze Handlowe:
- Krótkoterminowy skok podczas długoterminowego spokoju → Tymczasowy szum (ignoruj)
- Wszystkie okresy rosną → Prawdziwa zmiana reżimu (działaj)
- Krótkoterminowy spokój wśród długoterminowego chaosu → Fałszywy spokój (ostrożność)
🎯 PROFESJONALNE FUNKCJE
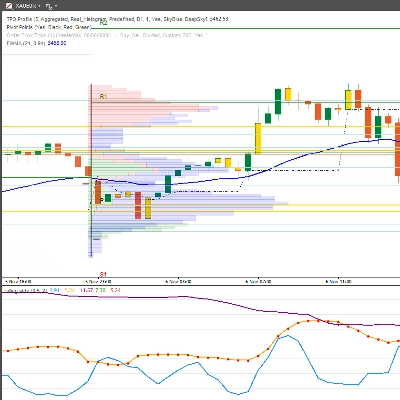
✨ WIDOCZNOŚĆ W TRZECH OKRESACH
- StdDev 7: Uchwyć natychmiastowe zmiany zmienności (intraday)
- StdDev 21: Zmienność średnioterminowa (swing trading)
- StdDev 63: Kontekst zmienności długoterminowej (position trading)
🚦 AUTOMATYCZNE SYGNAŁY HANDLOWE
- Zielone Strzałki Kupna: Okazje do kompresji zmienności
- Czerwone Strzałki Sprzedaży: Ostrzeżenia o ekspansji zmienności
- Inteligentne Progi: Konfigurowalne poziomy kupna/sprzedaży
📊 ZAawansowana ANALIZA ZMIENNOŚCI
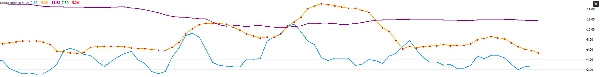
- Przecięcia Zmienności: Linie StdDev przecinające się = zmiany reżimu
- Sygnały Rewersji do Średniej: Zmienność wracająca do średniej
- Wykrywanie Skoków: Ekstremalne zdarzenia zmienności
💡 IDEALNE DLA TYCH STYLÓW HANDLU:
🎯 Traderzy Wybicia Zmienności
- Wejście podczas niskiej zmienności przed wybuchowymi ruchami
- Wyjście podczas wysokiej zmienności przed odwróceniami
- Precyzyjne wyznaczanie momentów wejścia dzięki potrójnemu potwierdzeniu
📈 Traderzy Rewersji do Średniej
- Pewne wykorzystanie ekstremów zmienności
- Identyfikacja nadmiernie rozciągniętych warunków rynkowych
- Wykorzystanie zmienności jako wskaźnika kontrariańskiego
🛡 Traderzy Unikający Ryzyka
- Całkowite unikanie okresów wysokiej zmienności
- Handel tylko podczas spokojnych, przewidywalnych rynków
- Wykorzystanie zmienności jako przewodnika do wielkości pozycji
📊 Traderzy Opcji
- Sprzedaż premii czasowej podczas wysokiej zmienności
- Kupno opcji podczas kompresji zmienności
- Analiza IV vs HV dla błędnej wyceny
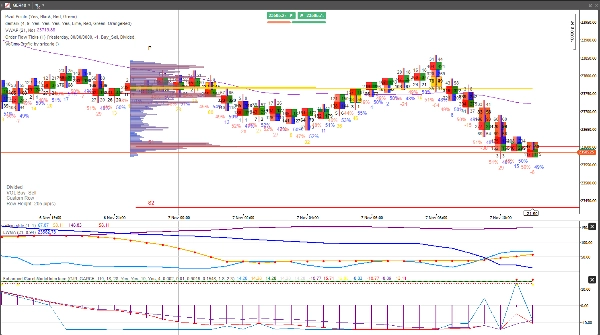
Wbudowane Inteligentne Sygnały:
- ✅ Kupuj, gdy: Zmienność spada poniżej progu LUB przecina się poniżej średniej kroczącej
- ✅ Sprzedawaj, gdy: Zmienność rośnie powyżej progu LUB przecina się powyżej średniej kroczącej
📈 CO OTRZYMUJESZ:
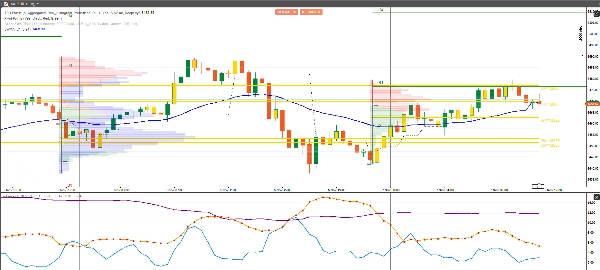
✅ Widoczność w trzech okresach - Koniec z domysłami co do kontekstu zmienności
✅ Automatyczne sygnały kupna/sprzedaży - Wyraźne wizualne strzałki w optymalnych punktach
✅ Wykrywanie reżimu zmienności - Wiedza, kiedy rynki są spokojne lub chaotyczne
✅ Konfigurowalne progi - Dostosuj do każdego stylu handlu lub aktywa
✅ Profesjonalne kodowanie kolorami - Natychmiastowe wizualne zrozumienie
💰 SPECJALNA CENA STARTOWA: 50 $
(Regularna cena: 100 $)
Podział wartości:
- Wskaźnik StdDev 7: wartość 29 $
- Wskaźnik StdDev 21: wartość 29 $
- Wskaźnik StdDev 63: wartość 29 $
- Sygnały handlowe: wartość 49 $
- Łączna wartość: 136 $
- Twoja cena: 50 $ (Oszczędzasz 35%)
W zestawie: Pełny wskaźnik + Aktualizacje na całe życie + Priorytetowe wsparcie
30-dniowa gwarancja zwrotu pieniędzy - Jeśli to nie poprawi Twojego timingu zmienności, zwrócimy każdy grosz.
🎁 BONUS: Darmowy Przewodnik po Timingach Zmienności
Zakup zawiera "Mistrzostwo Wielookresowej Zmienności" - darmową wartość 39 $.
Zawiera:
- Strategie handlu kompresją zmienności
- Techniki potwierdzenia wielookresowego
- Zarządzanie ryzykiem w okresach zmienności
- Przykłady transakcji z rzeczywistego świata
🚀 GOTOWY NA OPANOWANIE TIMINGU ZMIENNOŚCI?
Kliknij "Dodaj do koszyka" i zmień sposób, w jaki widzisz i handlujesz zmiennością rynku.
"Próbowałem wszystkich wskaźników zmienności. To podejście z potrójnym okresem i wbudowanymi sygnałami to coś, czego używam codziennie w moim handlu w firmie prop tradingowej."
- Sarah Rodriguez, Profesjonalna Traderka Swingowa
IDEALNE DLA TYCH RYNKÓW:
📊 Akcje i ETF-y
- Timing zmienności SPY, QQQ
- Rotacja sektorów oparta na zmienności
- Transakcje na zmienności wyników finansowych
💹 Pary Forex
- Analiza zmienności głównych par
- Ocena ryzyka carry trade
- Potwierdzenie wybicia
📈 Surowce
- Cykl zmienności złota
- Skoki zmienności ropy
- Sezonowa zmienność rolnicza
🔄 Kryptowaluty
- Reżimy zmienności BTC/ETH
- Okazje zmienności altcoinów
- Zarządzanie ryzykiem w kryptowalutach
Podsumowanie: To nie jest kolejny standardowy wskaźnik odchylenia. To kompletny system timingu zmienności, który pokazuje dokładnie, kiedy rynki mają się poruszyć.
Oferta limitowana na start: Pierwsze 150 kopii po 89 $ (oszczędzasz 30 $)
"Różnica między amatorskim a profesjonalnym handlem często sprowadza się do timingu zmienności. Ten wskaźnik tę lukę zamyka."
Dodaj do koszyka teraz → Zacznij handlować zmiennością jak profesjonalista


